
AI-powered weather intelligence
Most forecasts tell you what the weather will do. WeatherOptics predicts what it will do to your business, from road closures and power outages to delays and damage, up to 7 days in advance.
Join the list of industry leaders leveraging WeatherOptics















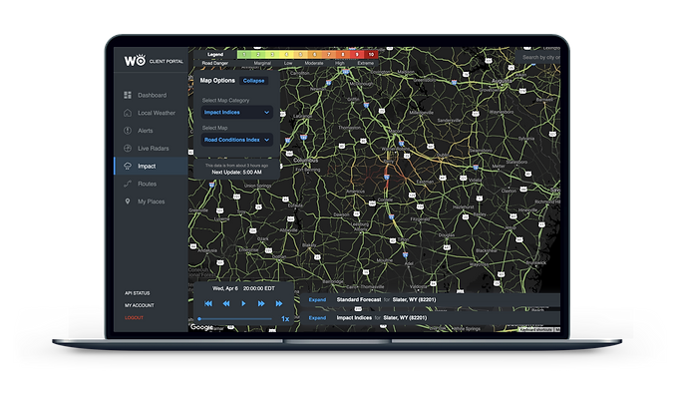
The forecast is the same for everyone. The impact isn't.
One inch of snow in Chicago is a normal day. One inch in Dallas shuts roads. Weather data alone can't tell the difference. Our impact models can.

One layer: the forecast. It tells you what the weather will be, but knows nothing about the roads, terrain, power lines or trees it's about to hit. Weather alone can't predict impact.
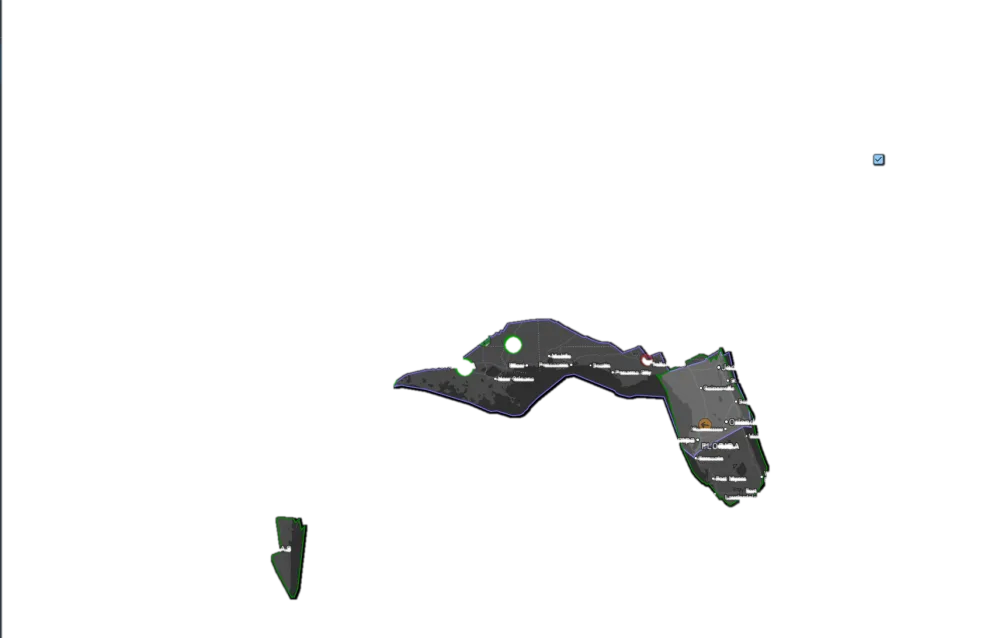
Eight layers: weather plus the real world. Roads, terrain, water, the power grid, trees and 15+ years of incidents are what turn a forecast into a predicted impact.
Skip the jargon. Get answers that lead to action.
Most weather data is written for everyone in its path, in dew points and wind speeds, and you are left to translate it. WeatherOptics talks in road closures, power outages and late shipments, for every asset you run.
What you get today
WINTER STORM WARNING for Cook County. Heavy snow expected. Total accumulations of 6 to 8 inches. Travel could be very difficult. In effect from this evening through Thursday.
The same storm, applied to your operation
A sample of the data behind every answer
Delivered where you already work: the Impact Intelligence Platform, alerts by text, email and in-cab audio, WeatherOptics Briefings, the API and the tools you already use. See all products
Set it up once. It watches everything from there.
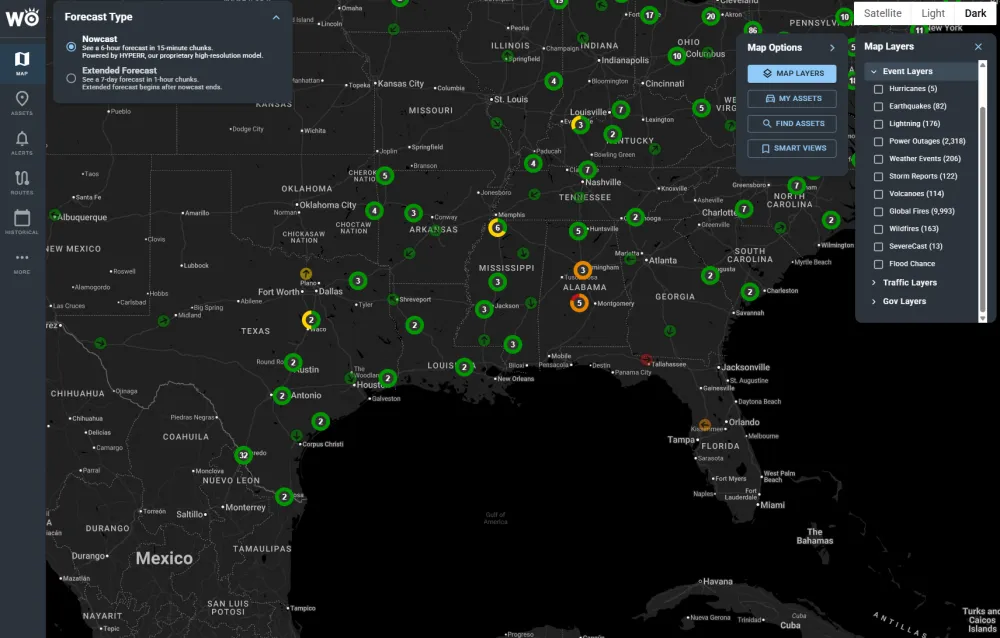
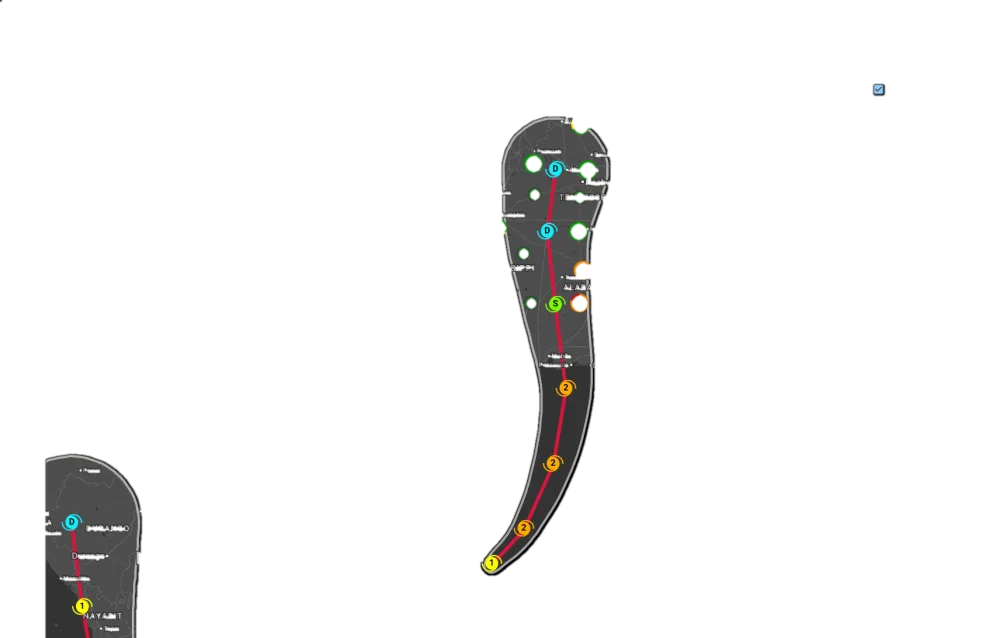
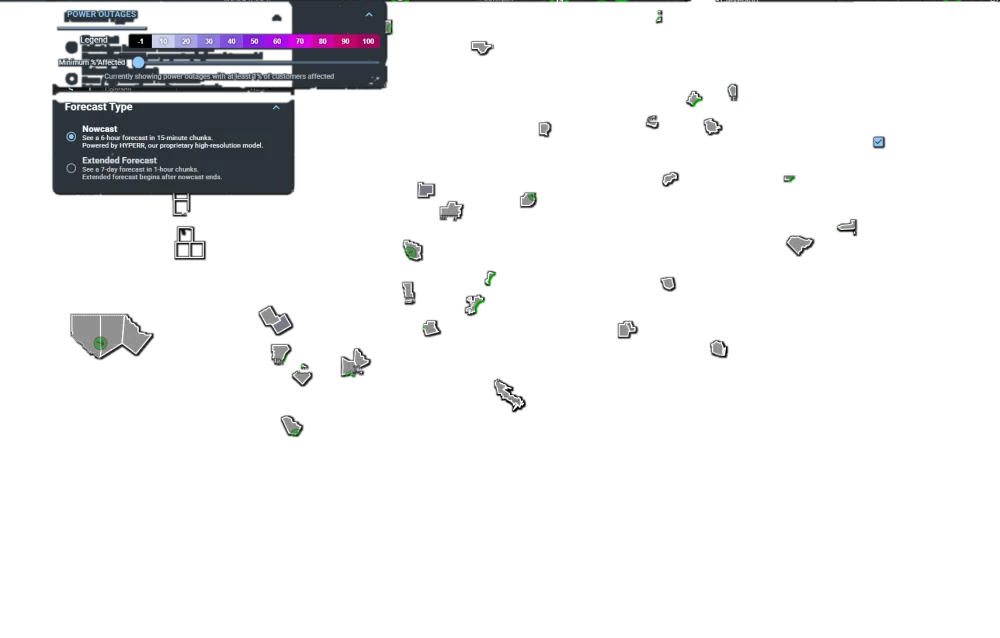
Connect your operation as a live digital twin
WeatherOptics mirrors what you run: every site, route, vehicle and zone, kept in sync with the systems you already use. Connect your TMS or ELD, upload a file, or send assets through the API. No portal login required.
Set your thresholds and your playbook
Decide what level of risk matters and to whom, then attach your own instructions: the action, policy or recommendation each team should follow when a rule fires. Our impact models check every asset against your rules around the clock, so nobody has to watch a map.
Insights reach you wherever you work
You only hear from WeatherOptics when something crosses your line, and it arrives in the place you already work: a text, an email, in-cab audio for the driver, the Impact Intelligence Platform, or your own systems through the API. With our MCP server, your team can also ask Claude, ChatGPT or another AI assistant directly.
Fewer weather incidents, more accurate forecasts
WeatherOptics forecasts the impact of weather on your operation, not just the weather. Here is what that has meant for the organizations using it, and how our accuracy measures up.
Fewer weather-related incidents. Across more than 150K vehicles using our predictive products.
Saved per winter weather event. For food shippers like Blue Apron, by acting before the storm arrived.
Lower forecast error vs. NOAA. Our AI model, HYPERR, compared with NOAA's HRRR model.
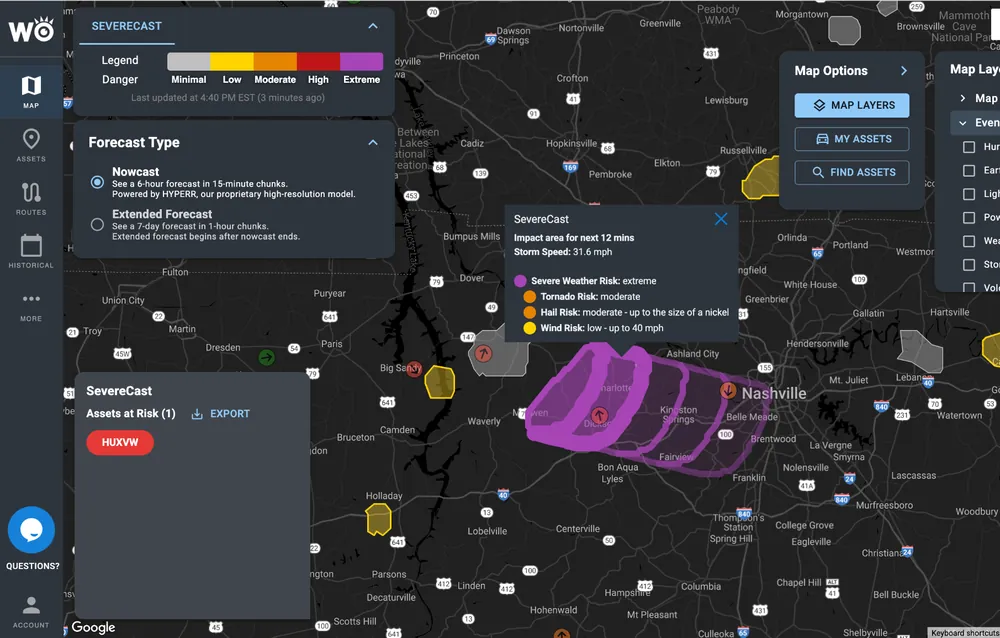
Fewer false alarms for Critical Events. SevereCast vs. NOAA warnings across 40K+ thunderstorms.
A system that gets smarter with every storm
We forecast the impact, then collect Impact Reports of what actually happened, and use the difference to improve our models. With each event and each day, WeatherOptics gets more accurate.
See which storms we would have flagged
Send us a handful of past incidents, delayed shipments or storms. We'll show you which ones we would have flagged, how far ahead, and what that was worth.
Become a WeatherOptics insider
Get insights on weather intelligence and operational resilience delivered to your inbox.