top of page
Hyperlocal Weather Layers
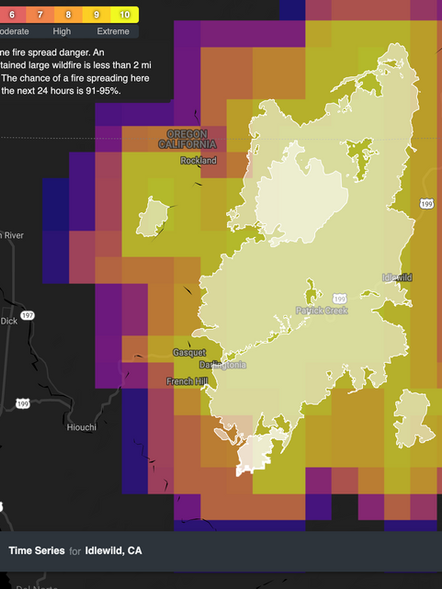
Choose to display or interact with a variety of different hyperlocal weather layers including temperature, rainfall, snowfall, wind speed, and wind gust
Aesthetic visuals that are data rich
Learn more about our underlying data here.
Mapping layers
Choose from temperature, wind speed, wind gust, snowfall, rainfall, and any of the proprietary WeatherOptics Impact Risk Scores
Global coverage
Mapping layers are available globally with real-time data and forecasts out to 7 days in advance
Compatible API
Visuals can be displayed on any base map using our API, including popular ones like Google, HERE, Trimble, MapBox, and ArcGIS
bottom of page


