The Impact of Hurricanes on Supply Chain
- Sep 3, 2020
- 6 min read
Updated: Jan 23, 2024
The value of freight in the United States has boomed in recent decades. The Bureau of Transportation Statistics (BTS) reports that in 2015 the total value of shipments in the US reached a staggering $19 trillion figure. Nearly half of that value of shipments was transported over relatively long distances greater than 250 miles, with trucks being the overwhelmingly dominant medium of transportation. By 2045, BTS projects the value of freight shipments to nearly double to $37 trillion.
Delays in the supply chain are therefore becoming increasingly detrimental to the national economy. With the FHWA attributing 23% of all roadway delays to inclement weather, which is expected to become more frequent due to climate change, it is more important than ever for supply chains to minimize disruptions from significant weather systems like hurricanes, which can lead to extreme ripple effects throughout the entire supply chain.

Long-range Road Danger forecast before Hurricane Laura
Delivery Delays
Delivery delays are the most common disruption from weather along the supply chain, causing headaches for shippers, carriers, and customers alike.
[There are] more than 32 billion lost vehicle hours annually, costing trucking companies anywhere from $2.2 to $3.5 billion dollars.
A 2012 study conducted by the US Department of Transportation and Cambridge Systematics found that nearly 5% of total truck driving hours were affected by adverse weather conditions including rain, snow, ice, visibility, and wind –– that’s more than 32 billion lost vehicle hours annually, costing trucking companies anywhere from 2.2 to 3.5 billion dollars (FHWA). Each weather type affects average speed and road capacity differently, but the combination of high winds and flooding rainfall from hurricanes leads to broader and longer-lasting delays than any other weather event.
Tropical Rainfall
Although rain on average poses less a significant threat to traffic than snow, its impacts on speed and capacity can still be substantial. Rakha et al. (2007) found statistically significant free-flow speed reductions in heavy rain in the range of 11-14% on highways in Minneapolis, Baltimore, and Seattle. Other studies aggregated by the FHWA reported even higher reductions up to 17%. These slowdowns are the result of heavy rain creating slick pavement, ponding or flooding of roadways, and reduced driving visibility, especially at night.
It should be noted that these delays were observed only in falling rain –– flooding was not a factor. Naturally, much greater delays can be expected on flooded roadways. Unsuspecting truck drivers can find themselves stranded in floodwaters, possibly resulting in the loss of cargo. In extreme situations, roadways may become completely submerged, blocking the entire roadway.
Hurricane Harvey 2017
Hurricane Harvey produced incredible rainfall of 35-60” over the course of 5 days between August 25-29, 2017, setting a new record for the wettest tropical cyclone. While a year’s worth of rain would lead to flooding anywhere, as NPR reports, its flooding was exacerbated by rapid urban development paving impervious blacktops and constructing buildings over what used to be marshland. The water had nowhere to drain, leading it to build on roadways and spill into bayous.
Major flooding on I-225 in Texas from Hurricane Harvey
Hurricane Irene 2011
Elevated terrain is also susceptible to flooding, and it may not take that much rain to produce it. Runoff rushes down mountainsides and accumulates in valleys, turning babbling brooks into raging rivers. It only took 5-8” of rain from Tropical Storm Irene to produce catastrophic flooding across Vermont in August 2011 in what was the state’s second greatest natural disaster in the last 120 years. A NOAA assessment one year after Irene found that the storm’s flooding resulted in over $733 million in damages, including the damage to or complete loss of over 2400 roadways, 800 homes and businesses, 300 covered bridges (including historic covered bridges) and 6 railroad tracks.


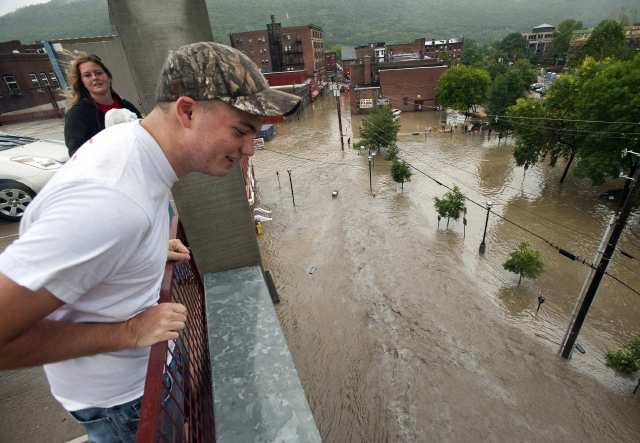
Vermont flooding from Tropical Storm Irene in 2011
Areas near large bodies of water are also highly susceptible to flooding. Storm surge can drown coastal highways for days at a time, forcing logistics companies to find new, longer, routes to their customers’ destinations. River and marshland flooding onto nearby highways can produce similar long-lasting road closures.
Logistics companies can try to route their trucks around hurricanes but even light rain can lead to delays. The Rakha et al. study found minor free-flow speed reductions of 2% - 3.4% for rain falling at a rate as low as 0.01”/hr or less. Considering the typically massive size of tropical systems (Harvey had a diameter of 280 mi at landfall), delays in shipping can be expected even when trucks are detoured hundreds of miles away from the extreme conditions near the eye.
Tropical Winds
High winds from tropical cyclones can make driving difficult by blowing vehicles off course. Large trucks and other high-profile vehicles are especially at risk since they can be tipped over, especially in winds of at least 60 mph. Exposed roadways in fields, mountainsides, or along overpasses can be particularly dangerous in high winds.
Winds can also scatter large debris on roadways or blow debris airborne. Wind can blow dust and heavy rain to reduce visibility, making it difficult to spot debris scattered on roadways. Some debris, like fallen trees or power lines, can make roads impassable, leading to significant delivery delays. If logistics operators fail to take into account woody areas, truck drivers may find themselves taking complicated detours –– even away from major thoroughfares.
Kyte, et al. (2000) and (2001) found no clear relationship between wind and driving speed but they did observe a “critical” wind speed of 14.9 mph, above which free flow speed dropped with 7.3 mph on average but with high variation.

Hurricane Harvey peak 10-meter wind gusts
The Operational Value of Delays
Delays due to hurricanes can incur severe economic costs, especially for the logistics industry. Over the past decade, efforts have been made to quantify the value of delays from inclement weather from the perspective of shippers.
..Delays cost shippers $56 per hour on average, plus $0.35 per percentage delay per hour.
Based on surveys of 24 logistics companies in Texas and Wisconsin, Wang et al. (2012) found that en route transportation delays are the most important component to shippers’ bottom line. They found based on a model developed from these surveys that delays cost shippers $56 per hour on average, plus $0.35 per percentage delay per hour. Since hurricanes can delay freight on the interval of days, the value of delays quickly add up from thousands of dollars per individual shipment of hundreds of thousands of dollars per fleet.
Supply and Demand
Hurricanes are well known to bolster demand for certain commodities like groceries and home repair. This creates inventory challenges as suppliers rush to satisfy consumer demand. In extreme cases, hurricanes can force the permanent relocation of tens of thousands to hundreds of thousands of people.
Hurricane Katrina
Hurricane Katrina forced the relocation of 1.5 million people according to the Bureau of Labor Statistics –– more people than fled the Plains during the Dust Bowl. This enormous migration can require dramatic changes in consumer demand in the areas where they concentrate, like in Houston, which became home to more than 200,000 Katrina evacuees.
Greater disruption throughout the supply chain can occur when extreme weather affects manufacturing and distribution hubs. Facility shutdowns can delay delivery of commodities, reduce truck capacity, and increase the cost of raw materials manufactured or imported. This leads to rising costs and reduced inventory of consumer staples.
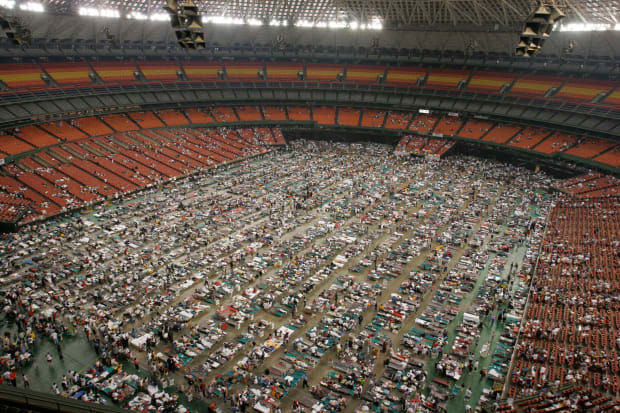
Thousands evacuated to the Louisiana Superdome as a last resort during Hurricane Katrina
Hurricane Harvey
Consider Hurricane Harvey’s dramatic impact on Houston, for example. Houston and southeast Texas are critical to gas and oil and petrochemical industries. In the results of an ISM survey released after Hurricane Harvey’s August 25, 2017 landfall, 67% of supply chain manager respondents felt that prices of raw materials would be “at least somewhat negatively” impacted over the next three months, and 56% of respondents felt that suppliers and deliveries would continue to be negatively impacted. Houston is also home to one of the nation’s busiest ports which was closed for a week after Harvey made landfall. The week-long closure of the Port of Houston led to extended delays of shipments of imports and exports.
Preparing Supply Chains for the Next Hurricane
Our team of meteorologists and engineers have worked closely with leading transportation companies to develop weather intelligent impact indices that allow supply chain managers to take action before and during high impact weather events such as hurricanes.
Both our Road Conditions Index and RightRoute API forecast the level of road danger, the likelihood of road closures, the weather-based ETA slowdown, and the different route options you can take to avoid significant issues for a given shipment. All of our forecasts can be utilized in real-time or out to 7 days in advance.

We work with shippers, carriers, and supply chain management companies to increase visibility and improve delivery window accuracy so events like hurricanes can become more manageable.
The latest forecast from the National Hurricane Center calls for a record breaking season with as many as 25 named storms, 11 hurricanes and 6 major hurricanes by November. Both Isaias and Laura have already caused major supply chain disruptions in the United States, and it’s likely we see several more high impact events over the course of the next 3 months.
Now is the time to weatherize your business –– if you’re interested in learning more about our weather intelligence, you can send us an email at info@weatheroptics.co.


Comments