One picture of what the storm will do to your region, days ahead
WeatherOptics forecasts the impact of weather on your region, not just the weather: where flooding, power outages and danger to life and property will hit, days ahead, through the response, with a record of what happened for recovery.
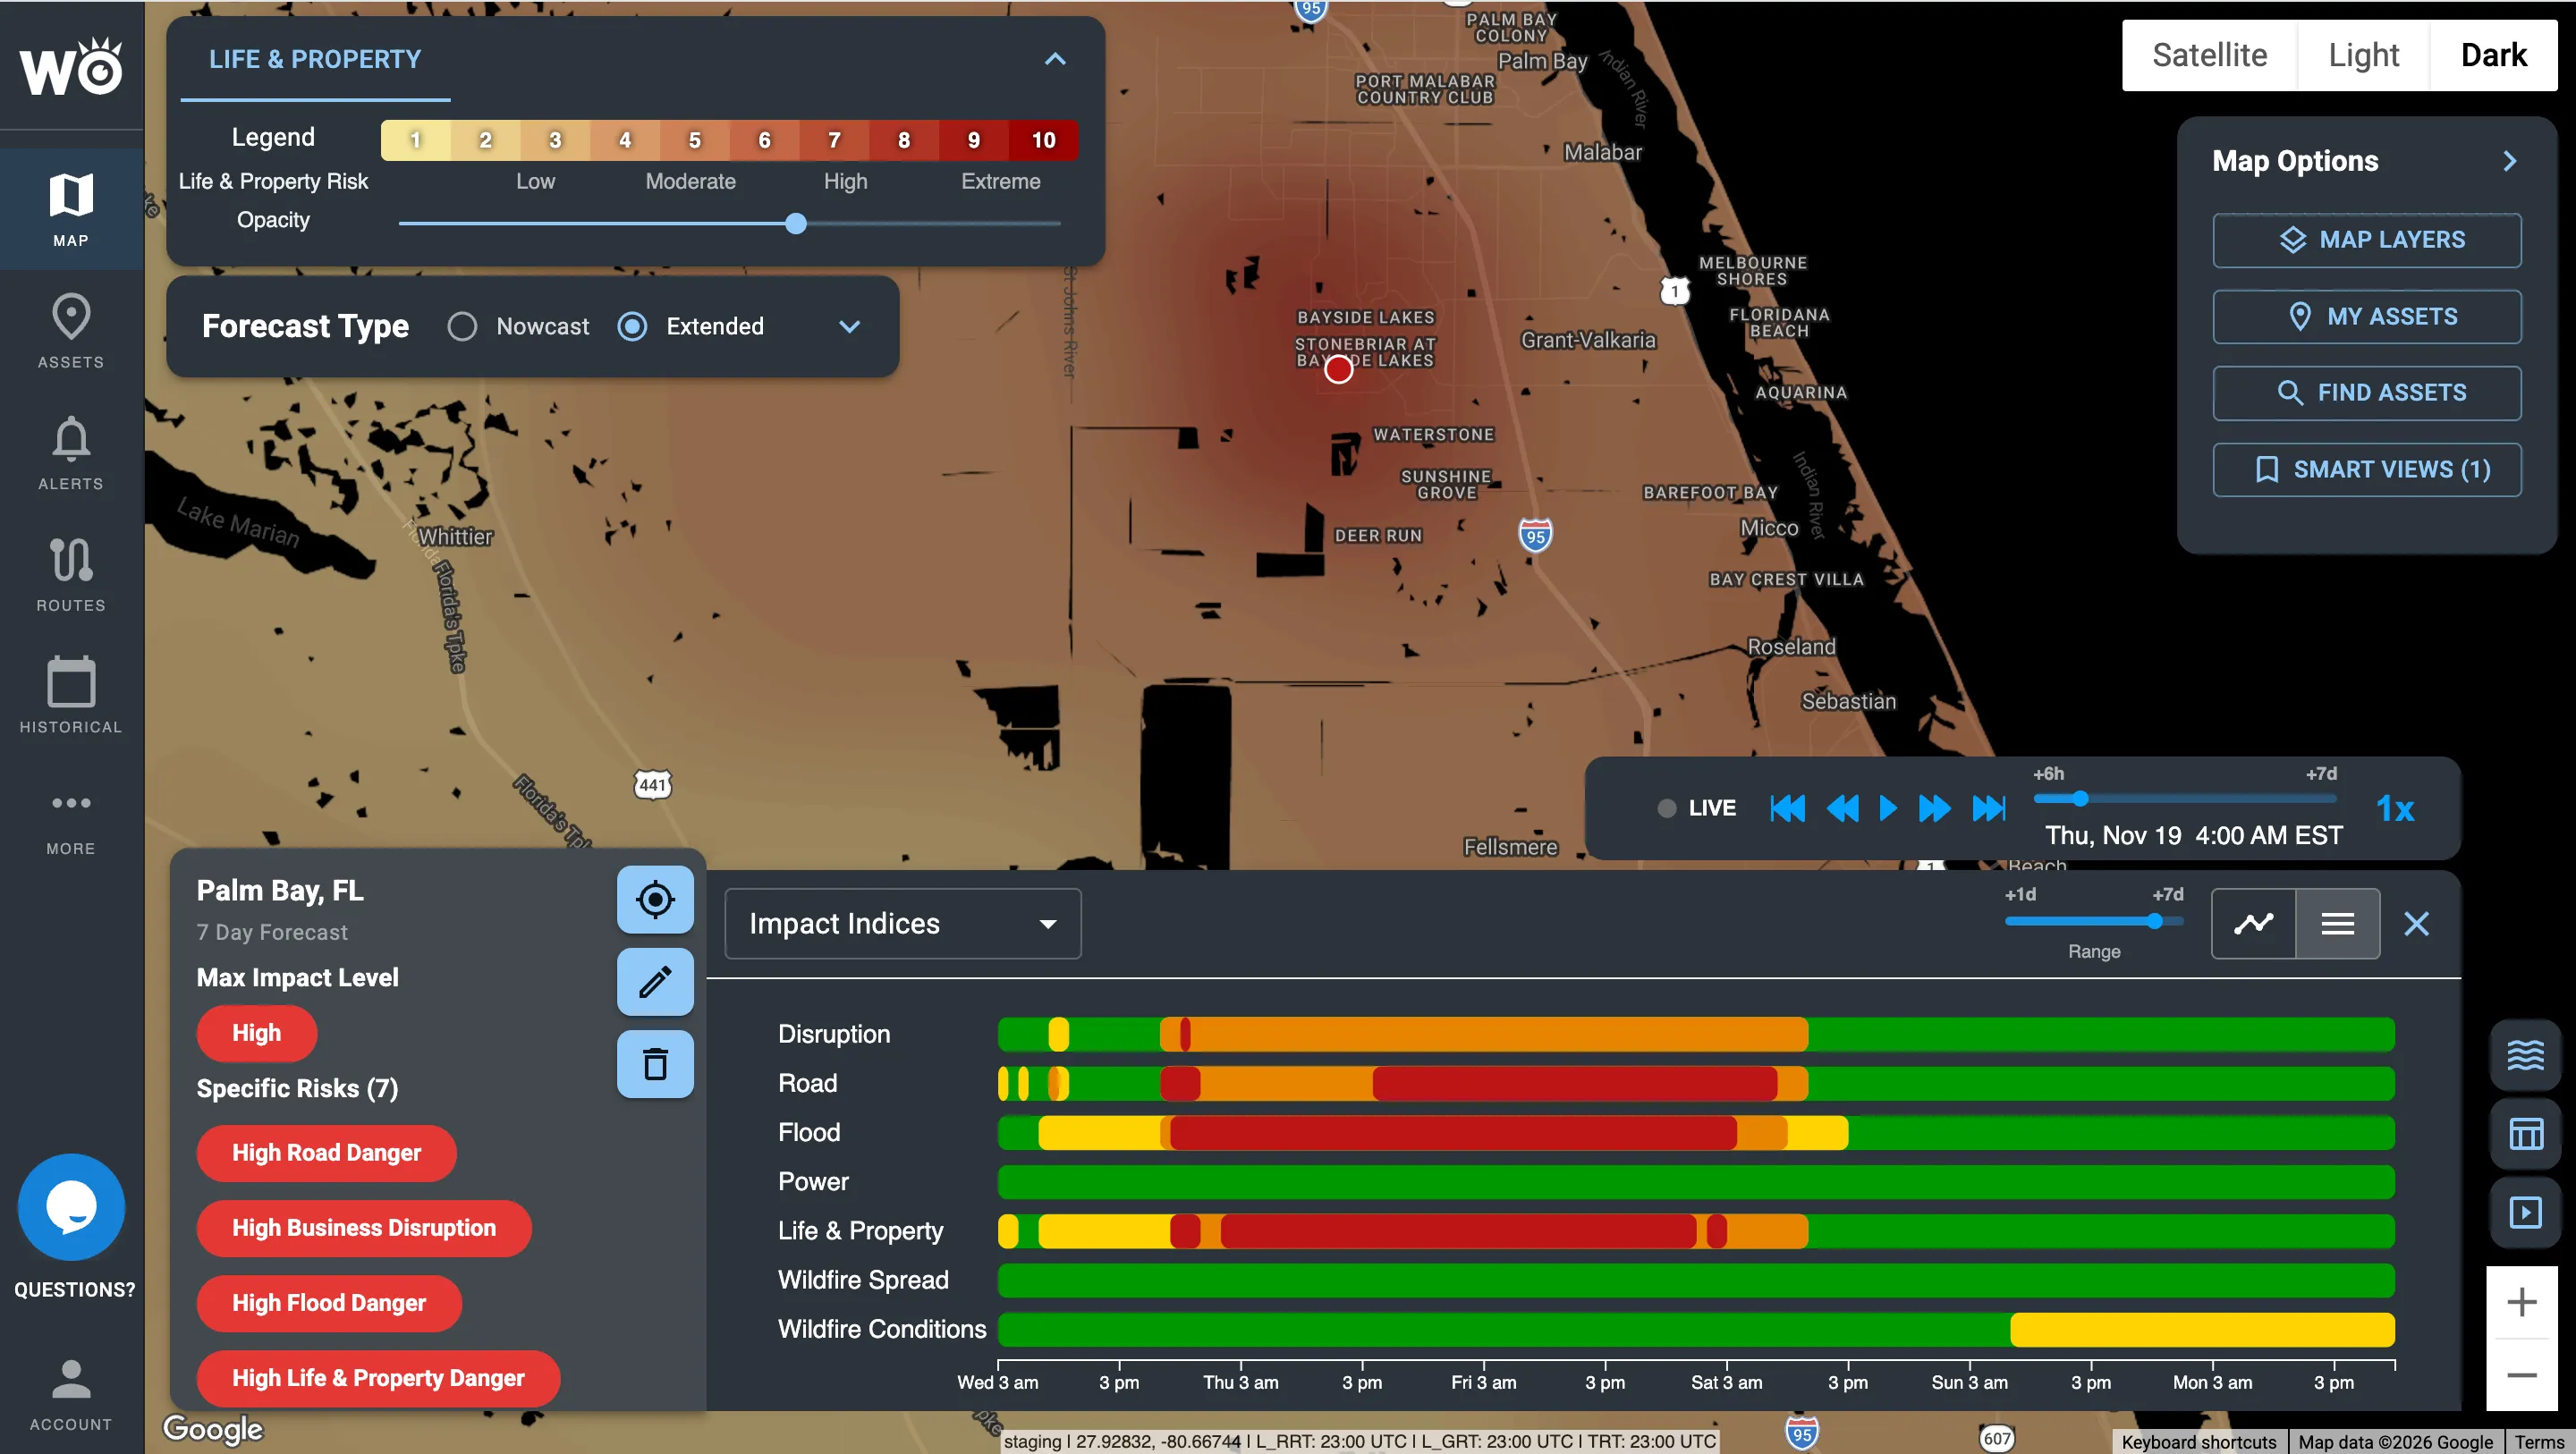
The Life & Property Index in the Impact Intelligence Platform: where the storm threatens people and buildings, scored 0 to 10.
What will this storm do to my region?
Today someone translates forecasts into impact by hand, which is slow, inconsistent and often too late. We do the translation for your whole region, from days before the storm through the recovery.
Days ahead: prepare
See where flooding, power outages and danger to life and property are expected 3–7 days out. Pre-position crews and supplies.
Hours ahead: act
Know which communities and sites will be hit first and how badly, so warnings and resources go where they're needed.
During: respond
Track the real threat inside each warning, storm by storm, and see which roads are closing and where the power is out.
After: recover and prove
See where damage, outages and closures are. Document what happened for disaster declarations and reviews.
Every major event outlined, and the real threat inside each warning
Critical Events outlines every major weather event coming your way, from winter storms to hurricanes and floods, with its footprint, timing, expected impacts and an AI briefing in plain language. SevereCast shows the real threat inside a warning, storm by storm, every 1–2 minutes.
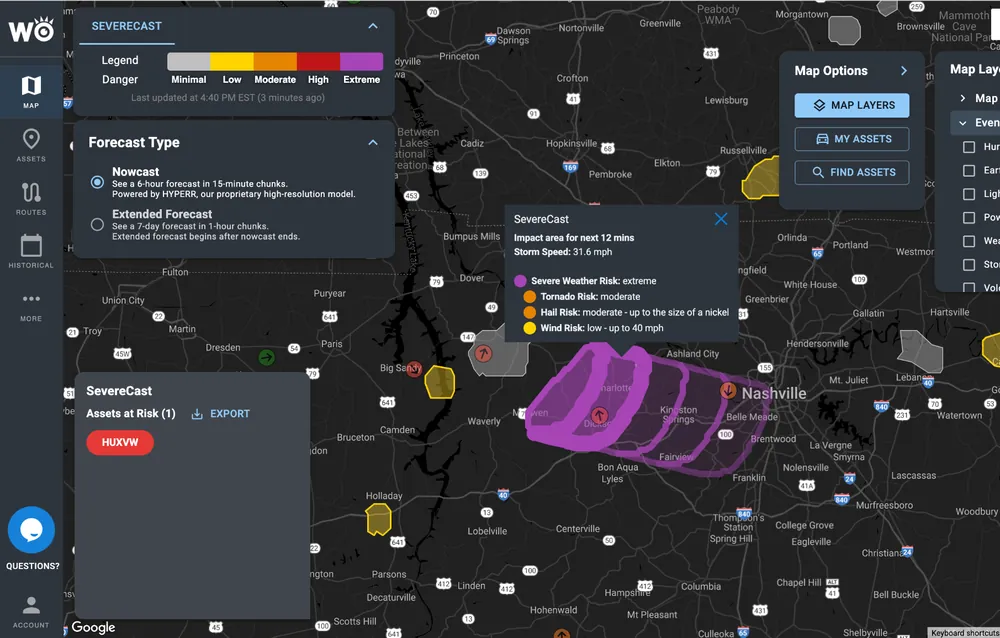
Storm by storm. SevereCast tracking a severe storm near Nashville, with tornado, hail and wind risk.
Built around your region, your sites and your people
Preparedness, response and recovery in one place, with the Impact Models and reports your team needs at each stage.
Flooding
Flood Risk Index shows where flooding will hit and how badly, days ahead.
Power
Power Outage Index forecasts where the power is likely to go out, so crews and shelters are ready.
Danger to people
Life & Property Index shows where a storm puts lives and property most at risk.
Wildfire
Wildfire Intelligence shows where fire is burning, how likely new fire is, and where it can spread.
What actually happened
Impact Reports show where the power went out, where the damage is and which roads closed, across your region, for response and recovery.
Alerts where you already work
Text and email alerts sent only when your thresholds are crossed, plus morning briefings. WeatherOptics also works inside Juvare WebEOC and Esri ArcGIS.
Proven on real storms
Of storms called correctly by SevereCast, vs about 70% for NWS alerts, with 10x fewer false alarms (6,033 verified reports, 2025 season).
Ahead on Hurricane Dorian road closures, flagged before the roads closed.
Lower forecast error than NOAA models, in a 12-month study.
Trusted across trucking, logistics and retail


What a hurricane looks like from the EOC
From the first forecast to the recovery record, here is what your team sees, and what they do with it.
Which counties take the worst of it
Critical Events outlines the storm. The Power Outage and Flood Risk Indexes show where the impact lands.
Which facilities and routes are exposed
Road Risk and Life & Property scores for every hospital, shelter and evacuation route, hour by hour.
One picture of the response
Live outages, damage reports and road closures on a single map, shared across agencies.
A record for recovery
Time-stamped forecasts and reports of what happened, location by location.
Illustrative example.
Works inside the tools your team already uses


Get started
- Book a demo for your region
- Run a 30-day pilot on your region
- Request the SevereCast accuracy report
See which storms we would have flagged
Send us a handful of past storms. We'll show you what we would have flagged for your region, and how far ahead.
Become a WeatherOptics insider
Get insights on weather intelligence and community resilience delivered to your inbox.