
We forecast what the weather will do, not just what it will be
Each Impact Model is a 0 to 10 risk score that predicts one kind of impact, from road danger and power outages to flooding and wildfire spread, for every site, route and vehicle you run, up to seven days ahead.
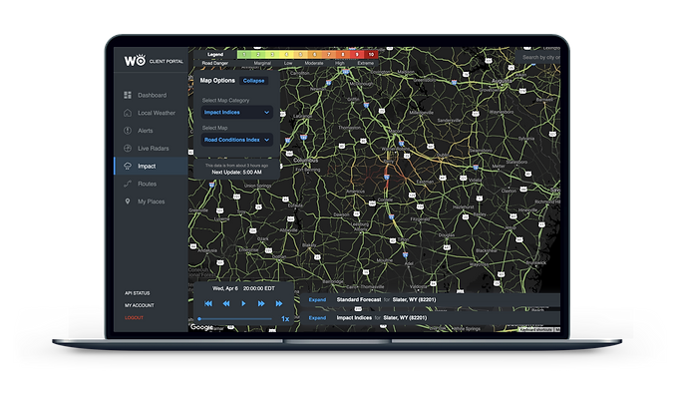
Weather is only one part of the equation
Start with a better forecast
HYPERR, our AI weather model, cuts forecast error by up to 40%. It runs at 3 km and looks seven days ahead.
Add the ground the weather lands on
Roads, bridges, power lines, rivers, flood zones, terrain, tree height and density, population and land use: hundreds of non-weather inputs for every location.
Train on what actually happened
Each model learns from real outcomes: 40M+ connected vehicles, 10 years of power outages across 50+ utilities, and years of storm damage and road closure records.
A separate model for each kind of impact, scored for every site, route, vehicle and zone you run.
Join the list of industry leaders leveraging WeatherOptics















Cut through the noise. Know what the weather will actually do.
A forecast tells you what's coming. It can't tell you what that means for your operation, and that is where the guesswork starts. Impact Models take the guesswork out.
Each score accounts for the roads, power lines, trees, terrain and local norms at that exact spot.
Closures, outages, flooding and delays, rather than inches of snow and miles per hour.
One score from 0 to 10 that anyone can act on, with no meteorologist needed to read it.
Plows and salt are ready, and drivers are used to it.
Little equipment, untreated bridges, and drivers who rarely see snow.
Each index predicts a different kind of impact
Every index is its own model, trained on what that kind of weather has actually done. Each returns a score from 0 to 10 for your sites, routes, vehicles and zones, hour by hour, up to seven days ahead.
Road Risk Index
Predicts: how dangerous each stretch of road will be to drive, hour by hour, including the risk of accidents and closures.
Use it to: hold or reroute loads before roads turn dangerous.
Power Outage Index
Predicts: the probability, area and share of customers expected to lose power, by the hour.
Use it to: stage generators and crews, and warn sites before the lights go out.
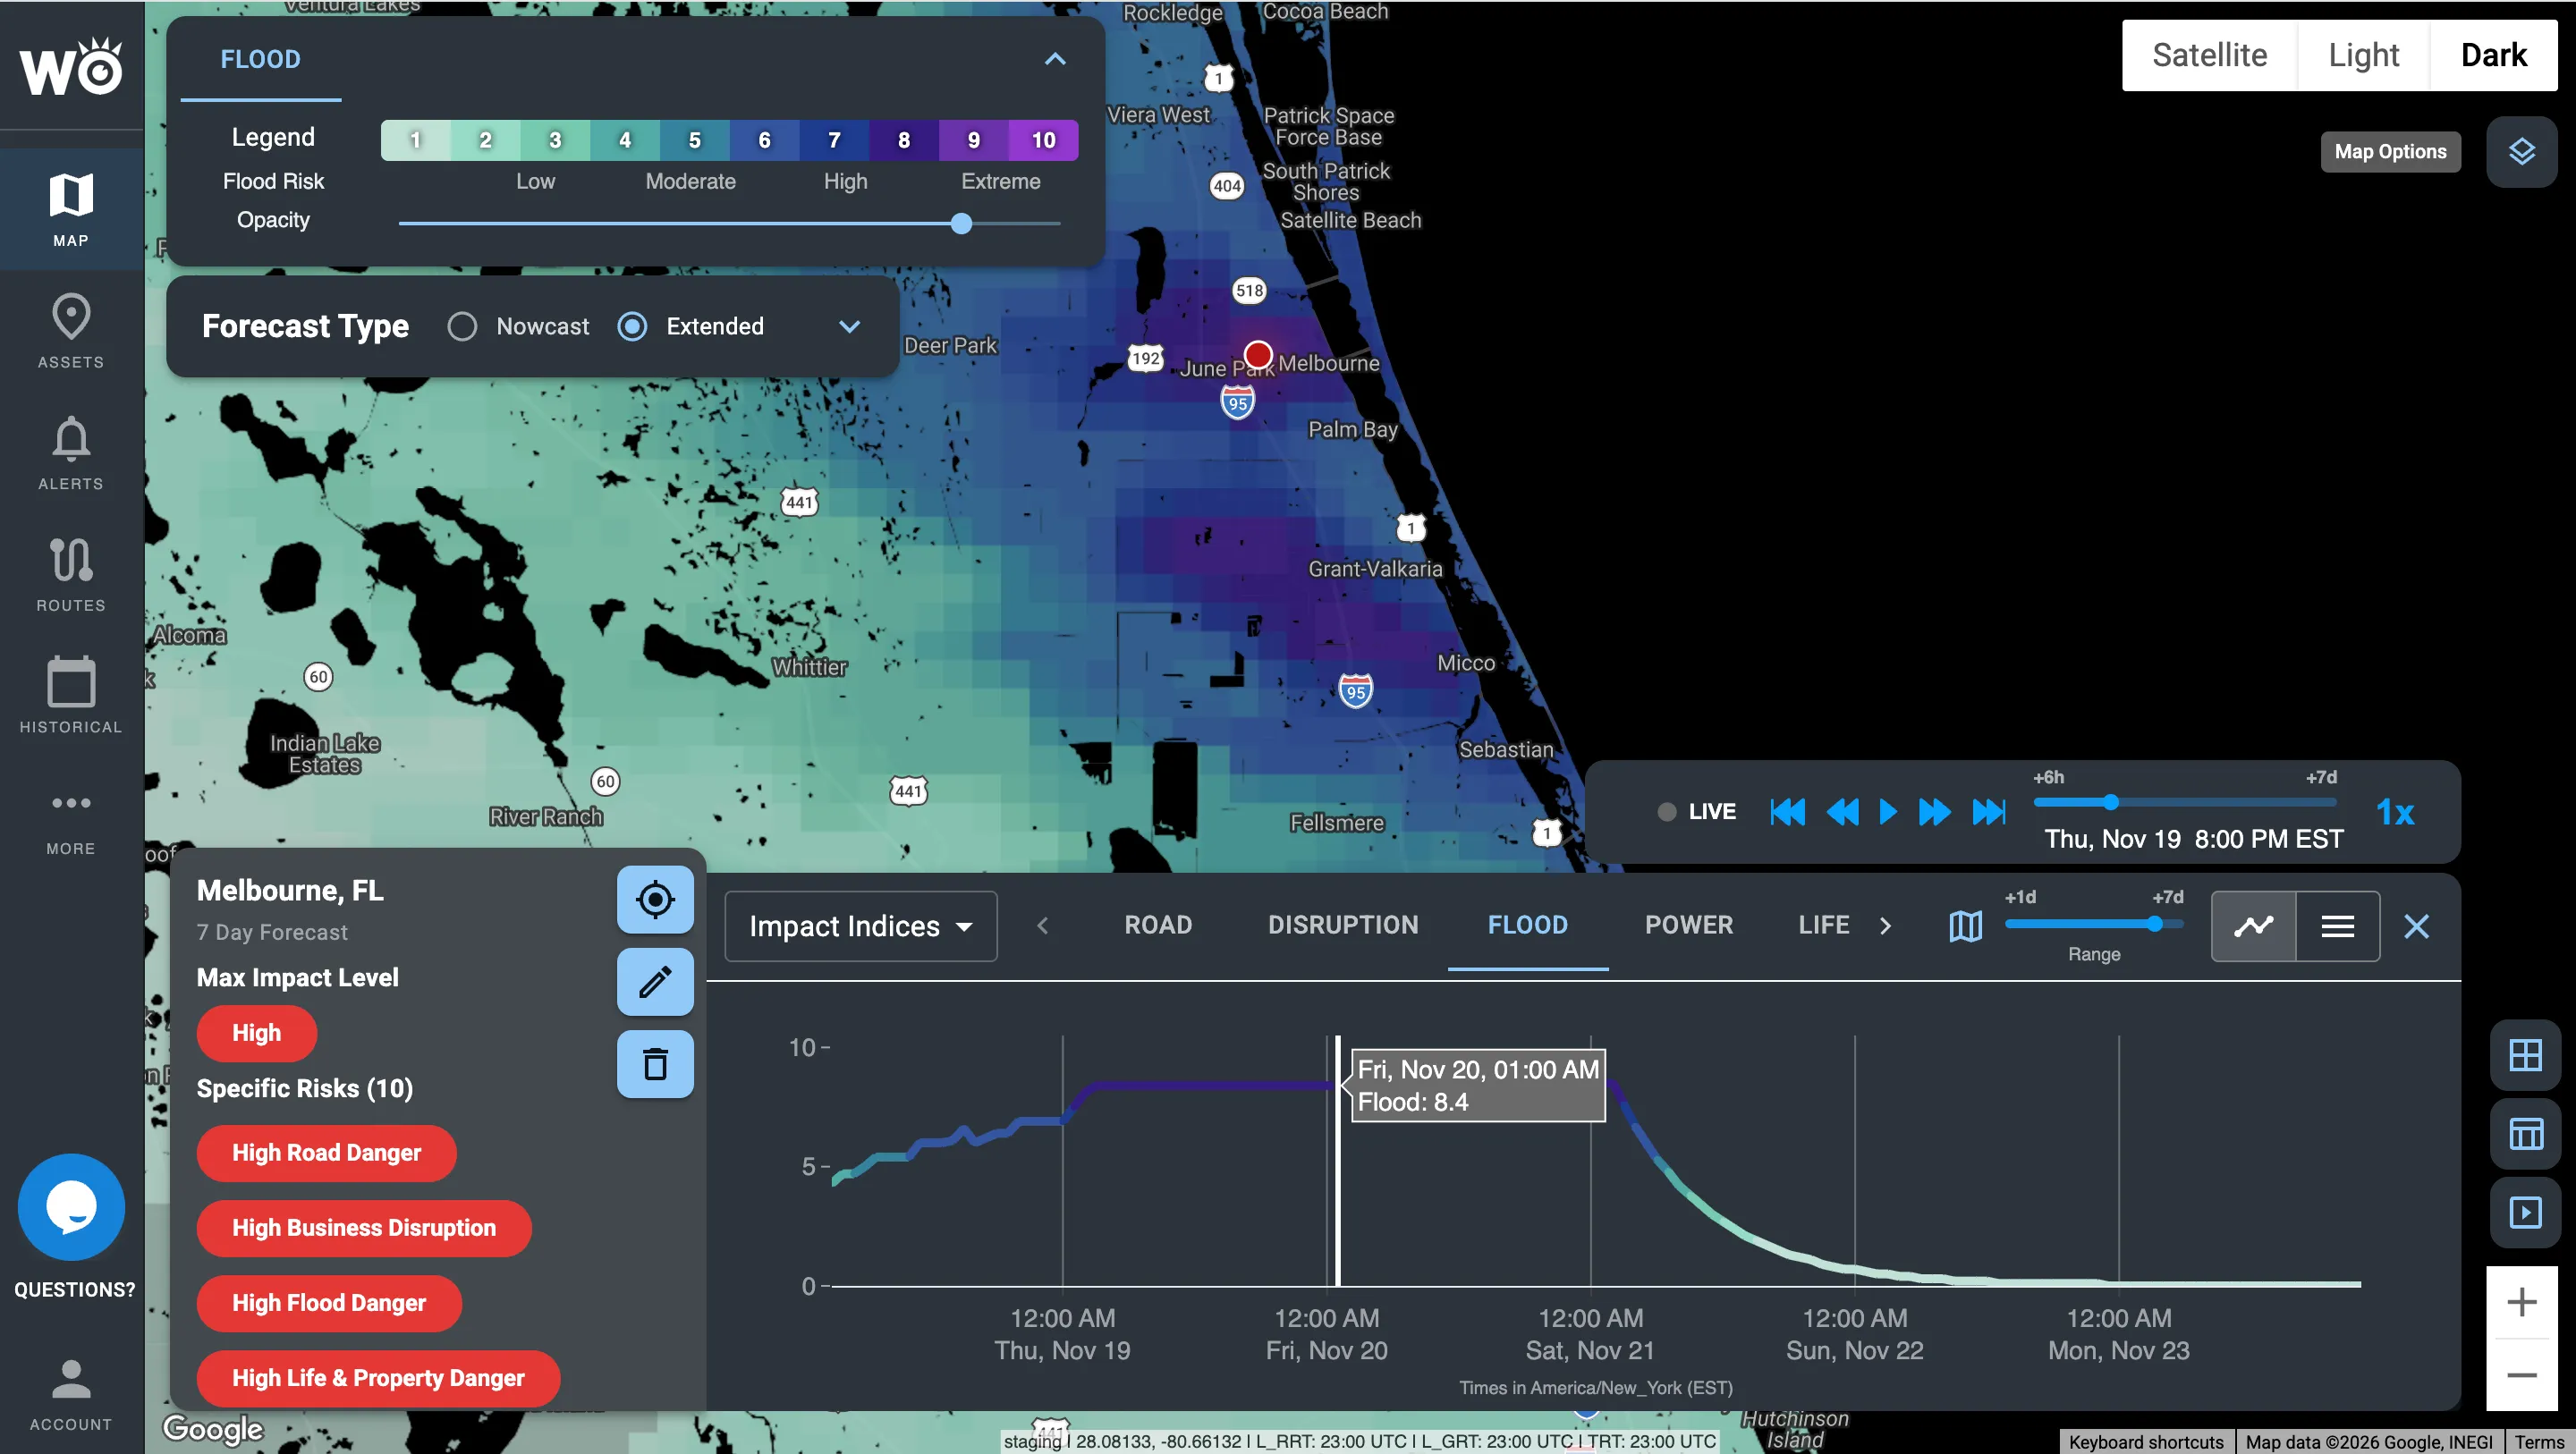
Flood Risk Index
Predicts: where flooding is likely and how severe it will be, from rainfall, rivers, terrain and flood zones.
Use it to: move people and inventory, and close low-lying sites early.
Life & Property Index
Predicts: the danger to people, and the risk of physical damage to buildings and infrastructure.
Use it to: decide when to shelter, evacuate or close.
Business Disruption Index
Predicts: the overall disruption to a store, distribution center or site, weighing the other indexes for that location.
Use it to: plan staffing, hours and inventory site by site.
Speed Reduction Index
Predicts: how much slower than normal traffic will move because of the weather, as a percentage.
Use it to: set ETAs that hold and reschedule deliveries early.
Rollover Index
Predicts: crosswind rollover risk for high-profile vehicles, by vehicle type, weight and direction of travel.
Use it to: hold light or empty trailers before crosswinds peak.
Crash Index
Predicts: how much the weather raises the chance of crashes on each road.
Use it to: warn drivers and adjust dispatch in the riskiest hours.
Temperature Seasonality Index
Predicts: how extreme temperatures will be against what is normal for that place and time of year.
Use it to: get ahead of demand swings and protect temperature-sensitive freight.
Wildfire Conditions Index
Predicts: where the weather favors new fire, up to seven days ahead.
Use it to: position crews and plan around high-risk days.
Wildfire Spread Index
Predicts: where each active fire is most likely to spread over the next 24 hours.
Use it to: see which sites and routes sit in a fire's path.
A different kind of impact?
Every index is built the same way, so we can model new kinds of impact for your operation. Talk to us
The Indexes in the platform
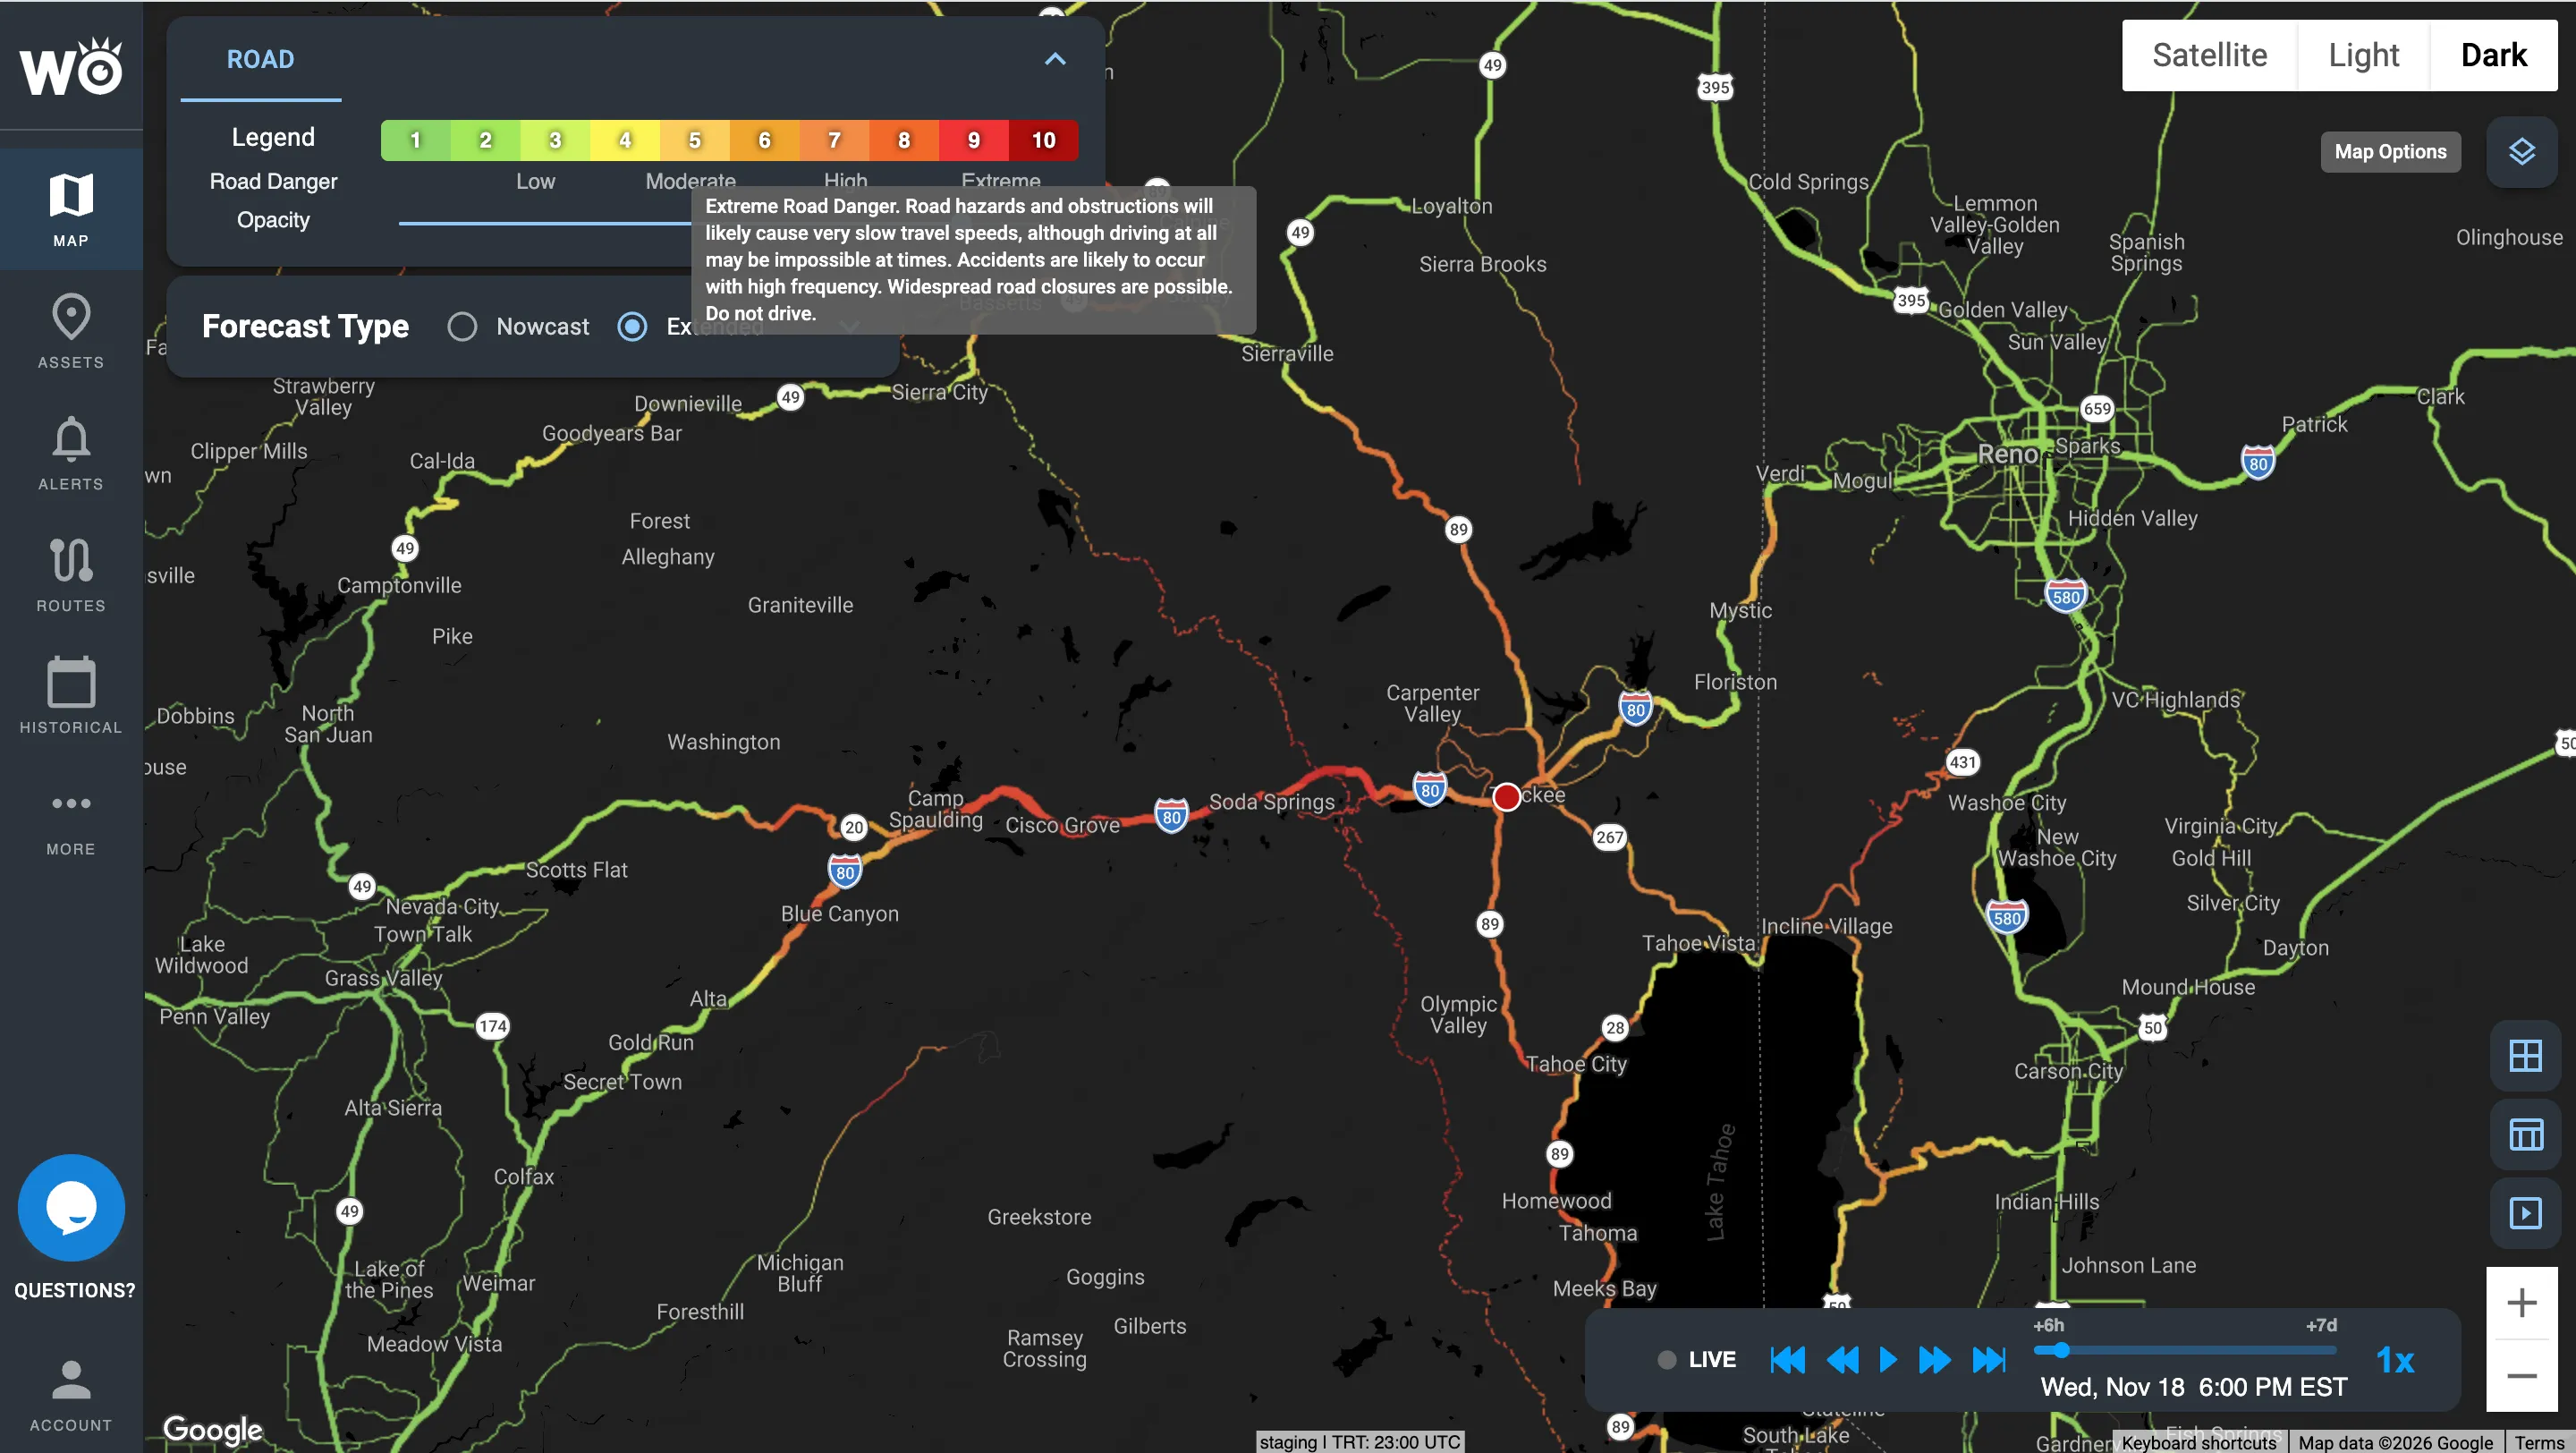
Road Risk Index along I-80 near Truckee, California
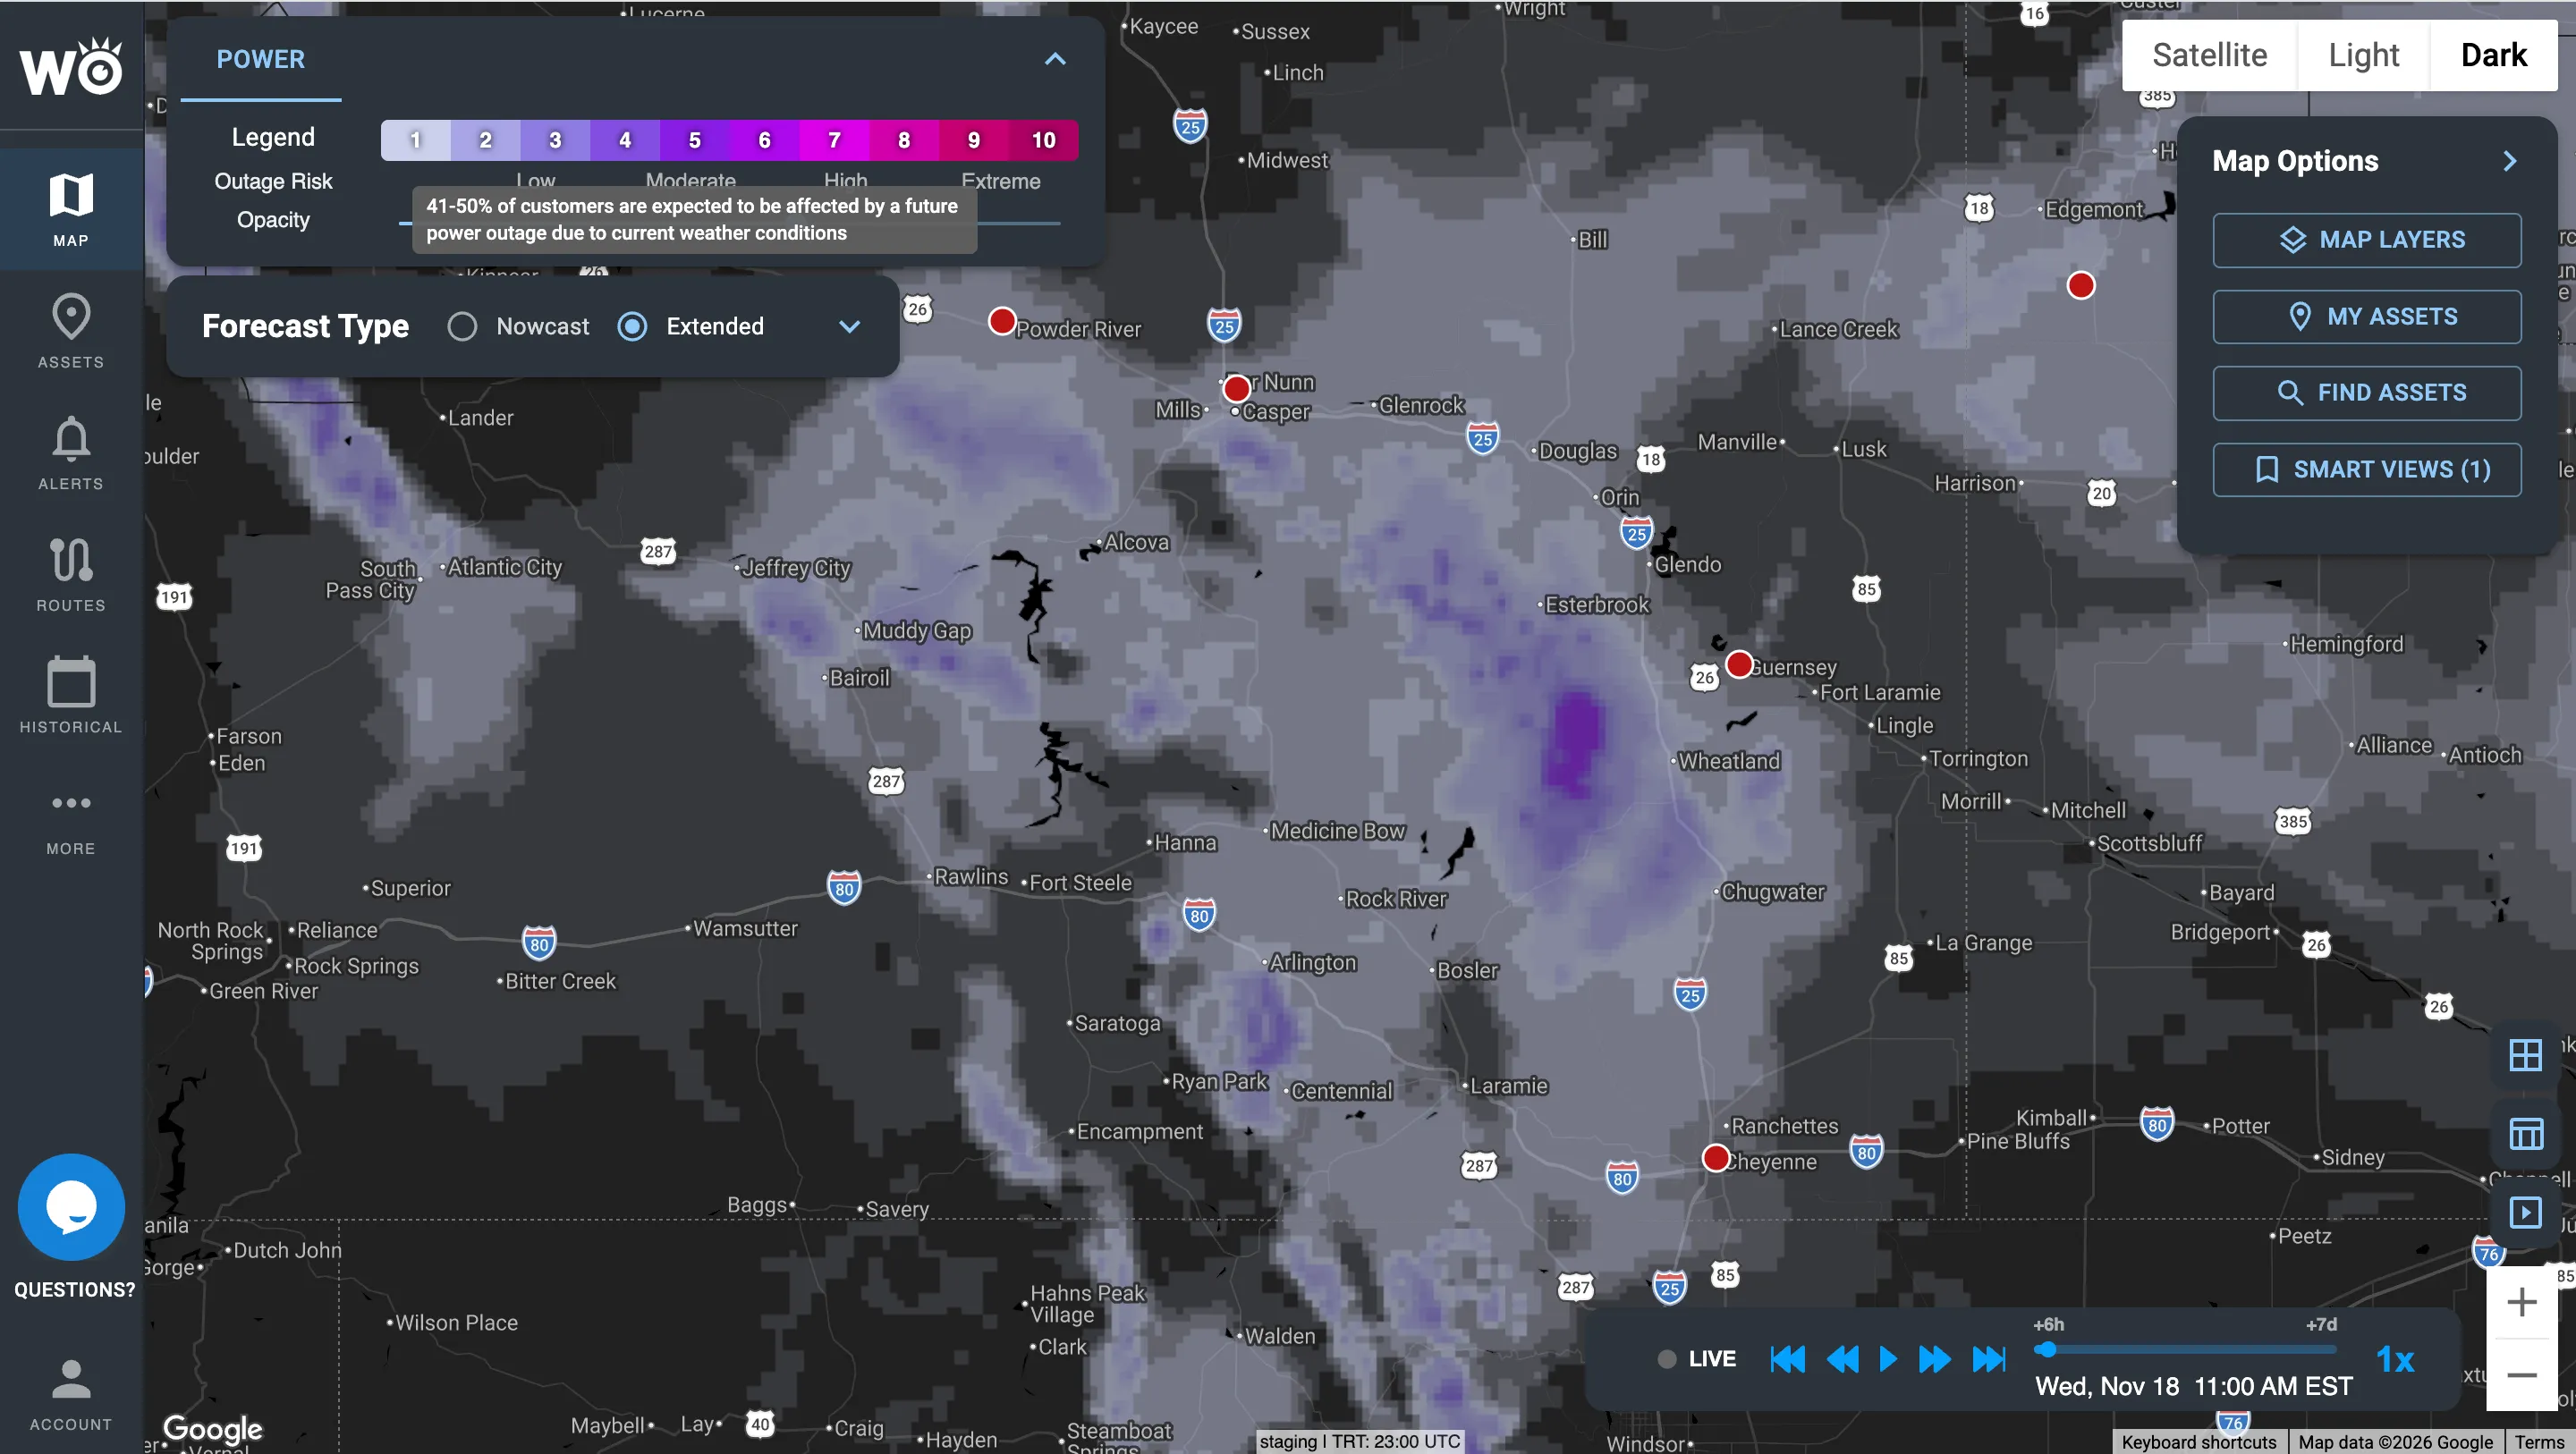
Power Outage Index across Wyoming
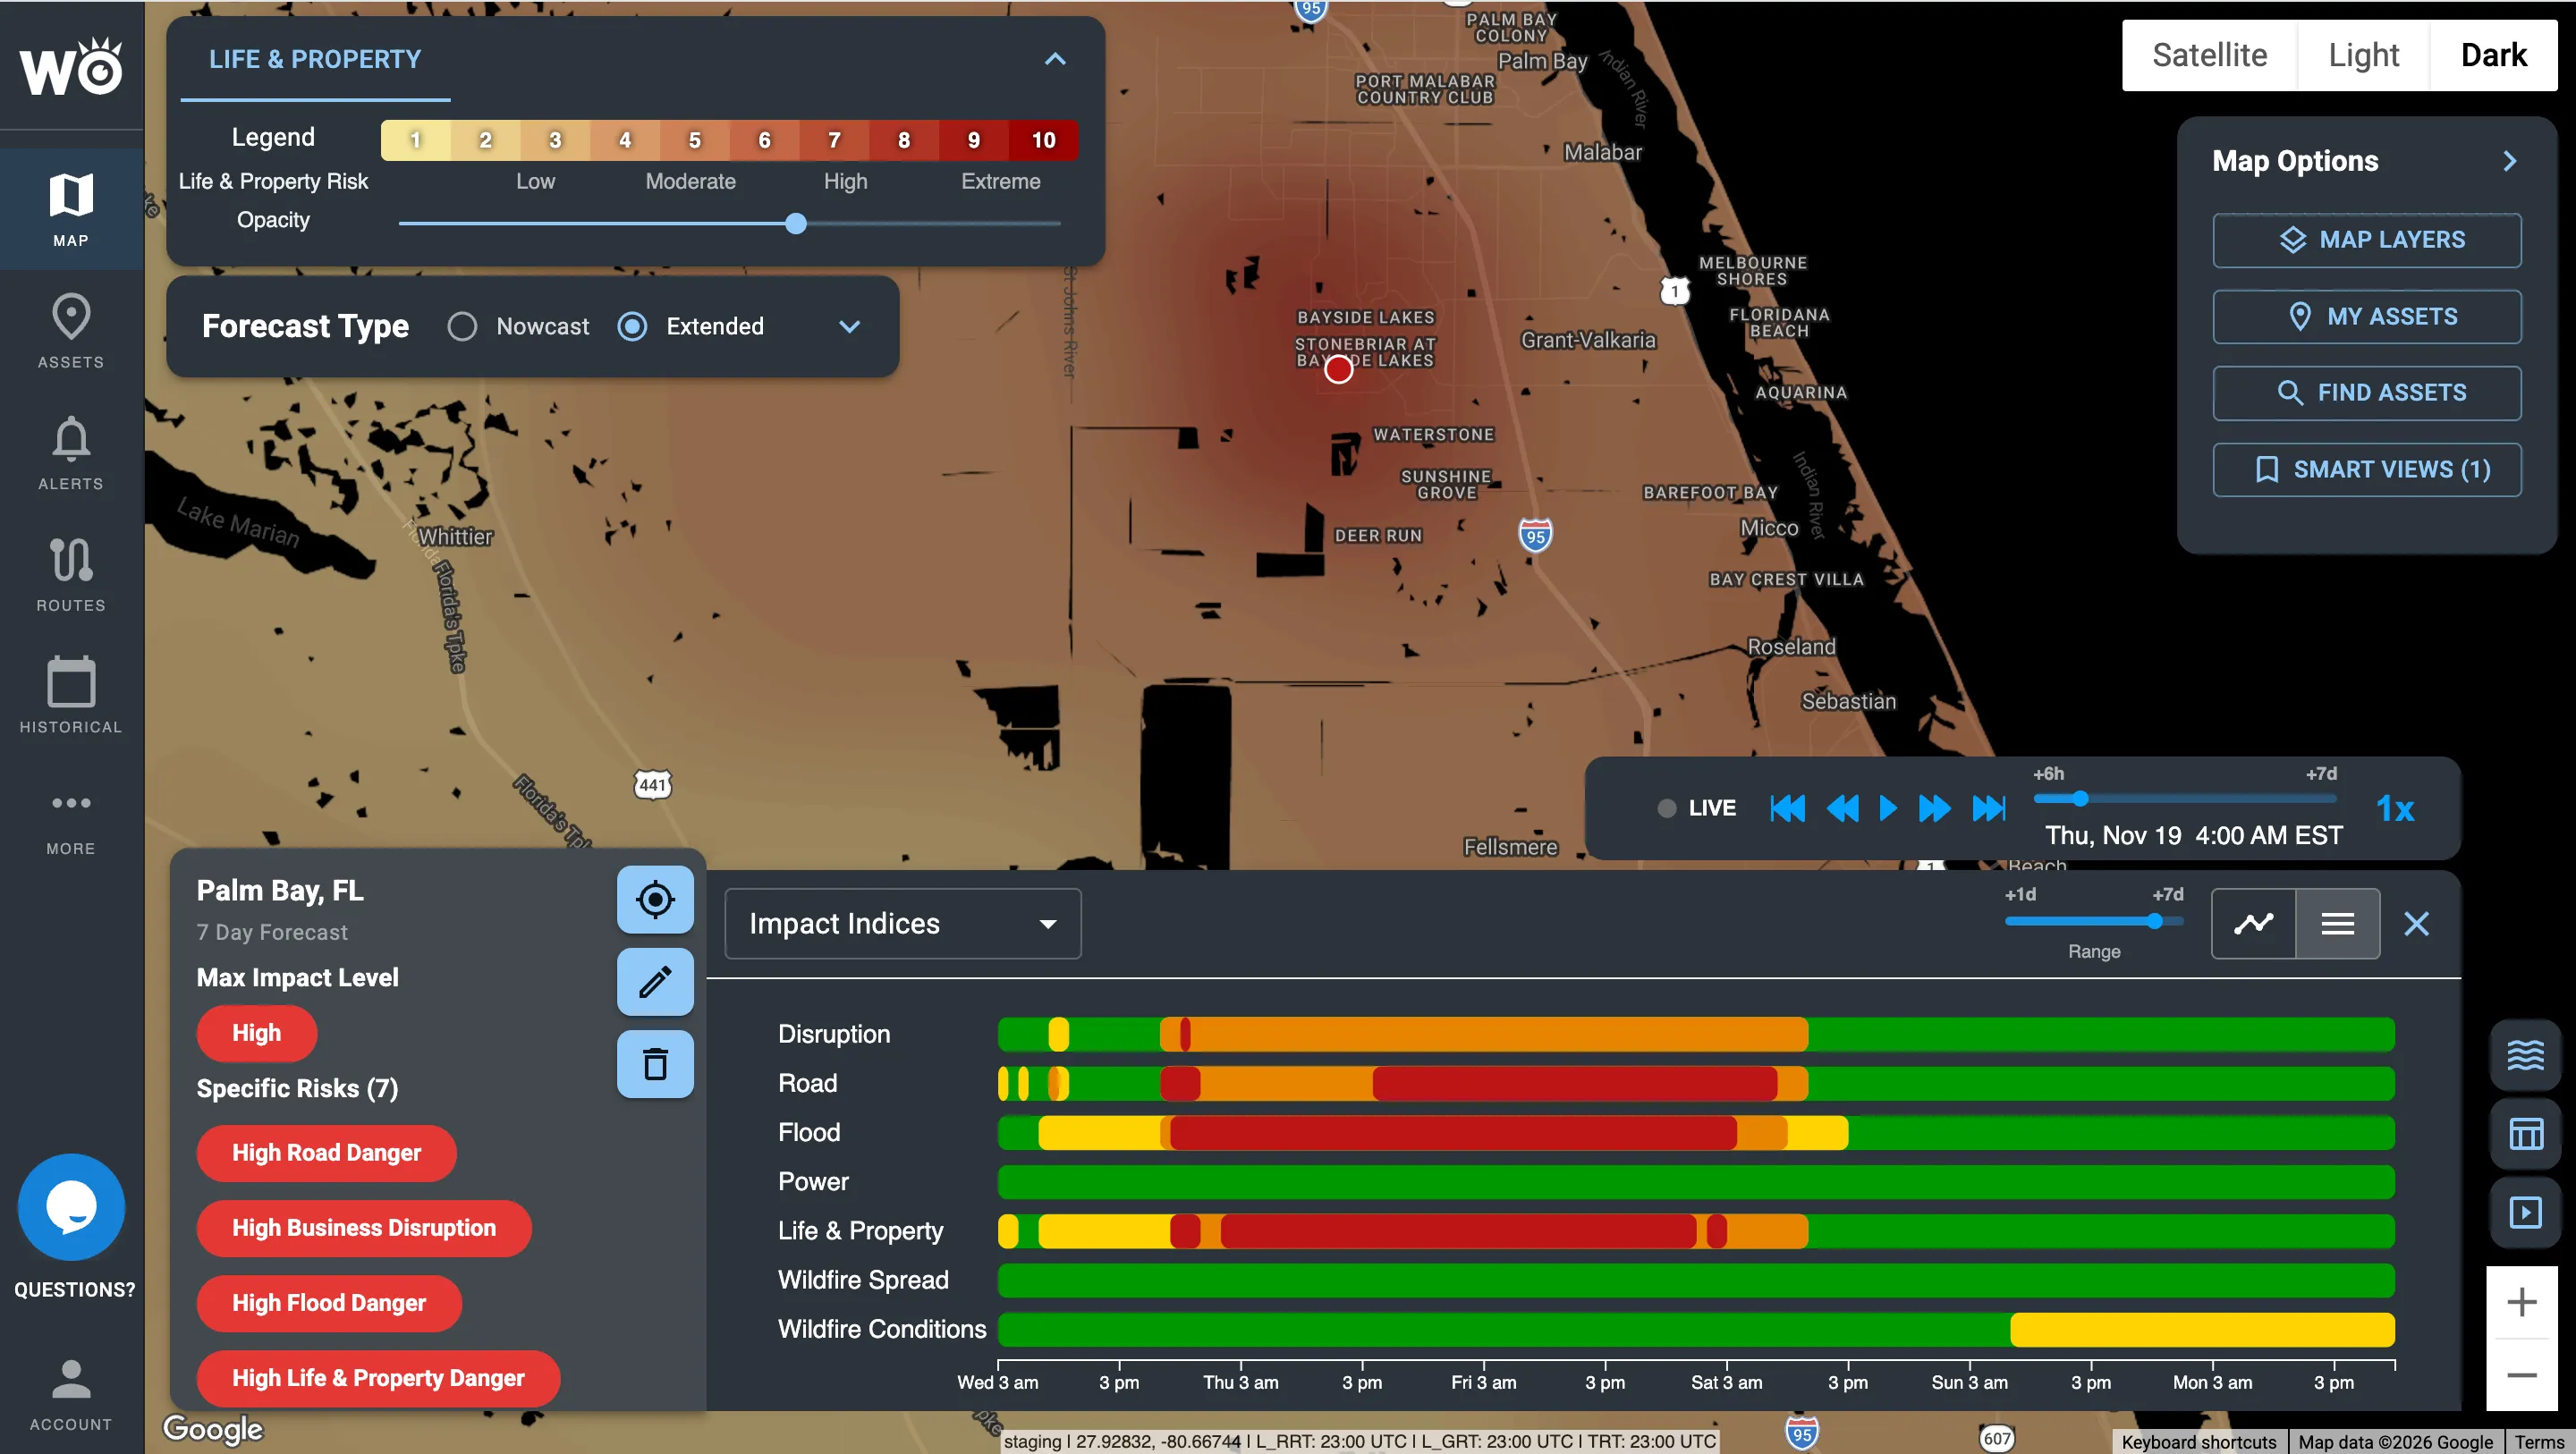
Life & Property Index around Palm Bay, Florida, with every index across seven days
Impact Models predict the impact; Impact Reports confirm it. After the storm, see where power actually went out, where the damage is and which roads closed, against your sites. See Impact Reports
Hundreds of inputs in. One number out.
Behind every score is an AI weather model, hundreds of ground inputs and years of impact history. What your team sees is a number from 0 to 10 that reads the same in dispatch, in the emergency operations center and in the boardroom. Seven and above is where high impact starts.
Hover over any level to see what it means. Wildfire Spread uses its own cutoffs, shown in its row.
Winter Storm Fern: the impact, called days ahead
Fern spread snow and ice across 34 states, cut power to more than a million customers and shut down major interstates. The forecast said a winter storm was coming. The Impact Models said what it would do, and where.
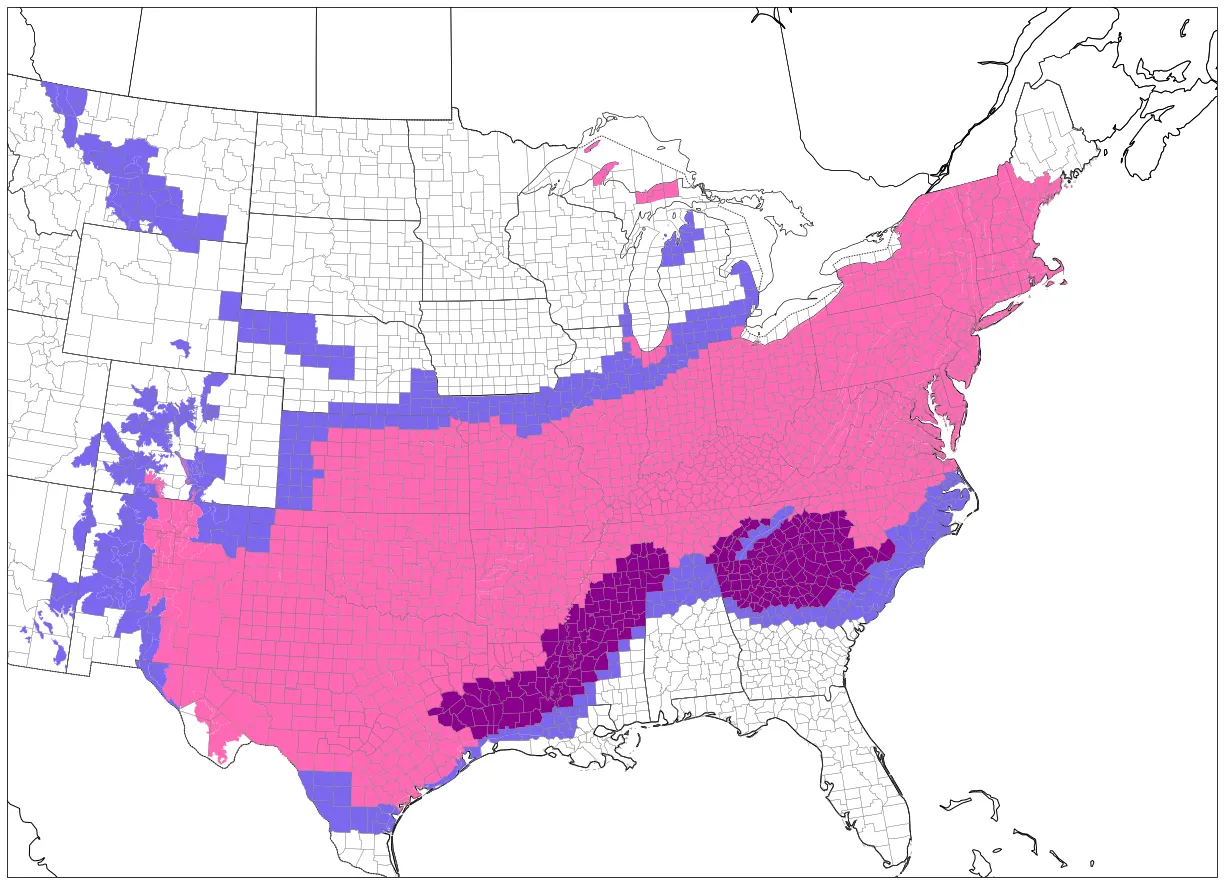
Winter weather alerts during Fern. 230 million people were under one.
What the alerts told everyone: a big winter storm
The same alert covered most of the country. It could not say which roads would close or which counties would lose power. The storm went on to cause:
34 states and more than 230 million people affected
1M+ customers without power, some for up to a week
I-20, I-40, I-49 and I-69 shut down by major accidents
13,000 flights cancelled
What the Impact Models showed days earlier
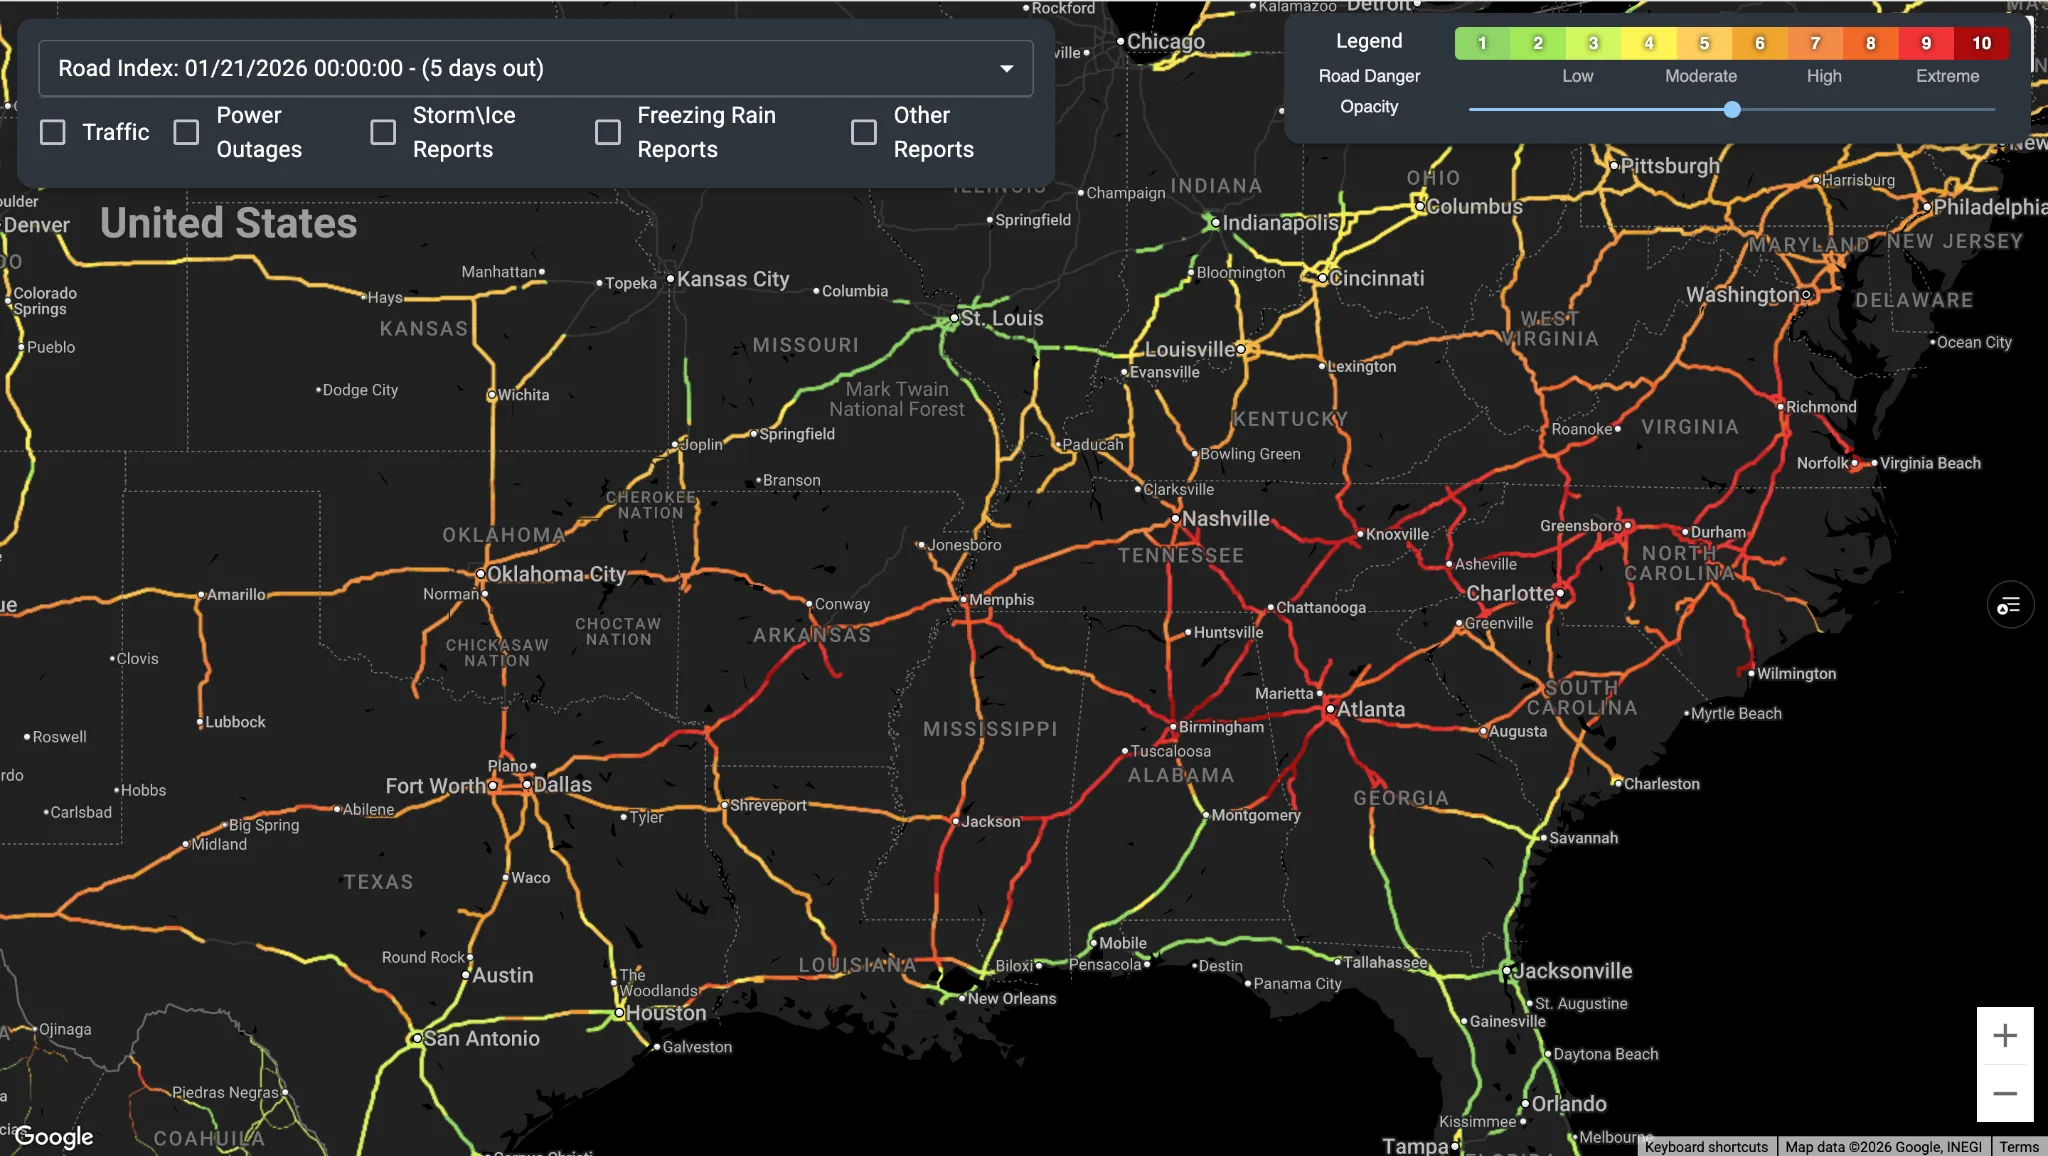
Roads: scores above 8 across the South and Mid-Atlantic
Predicted: Road Risk scores above 8.0 more than five days before Fern arrived, pointing to accidents and closures.
What happened: major accidents and closures on I-20, I-40, I-49 and I-69, some lasting several days.
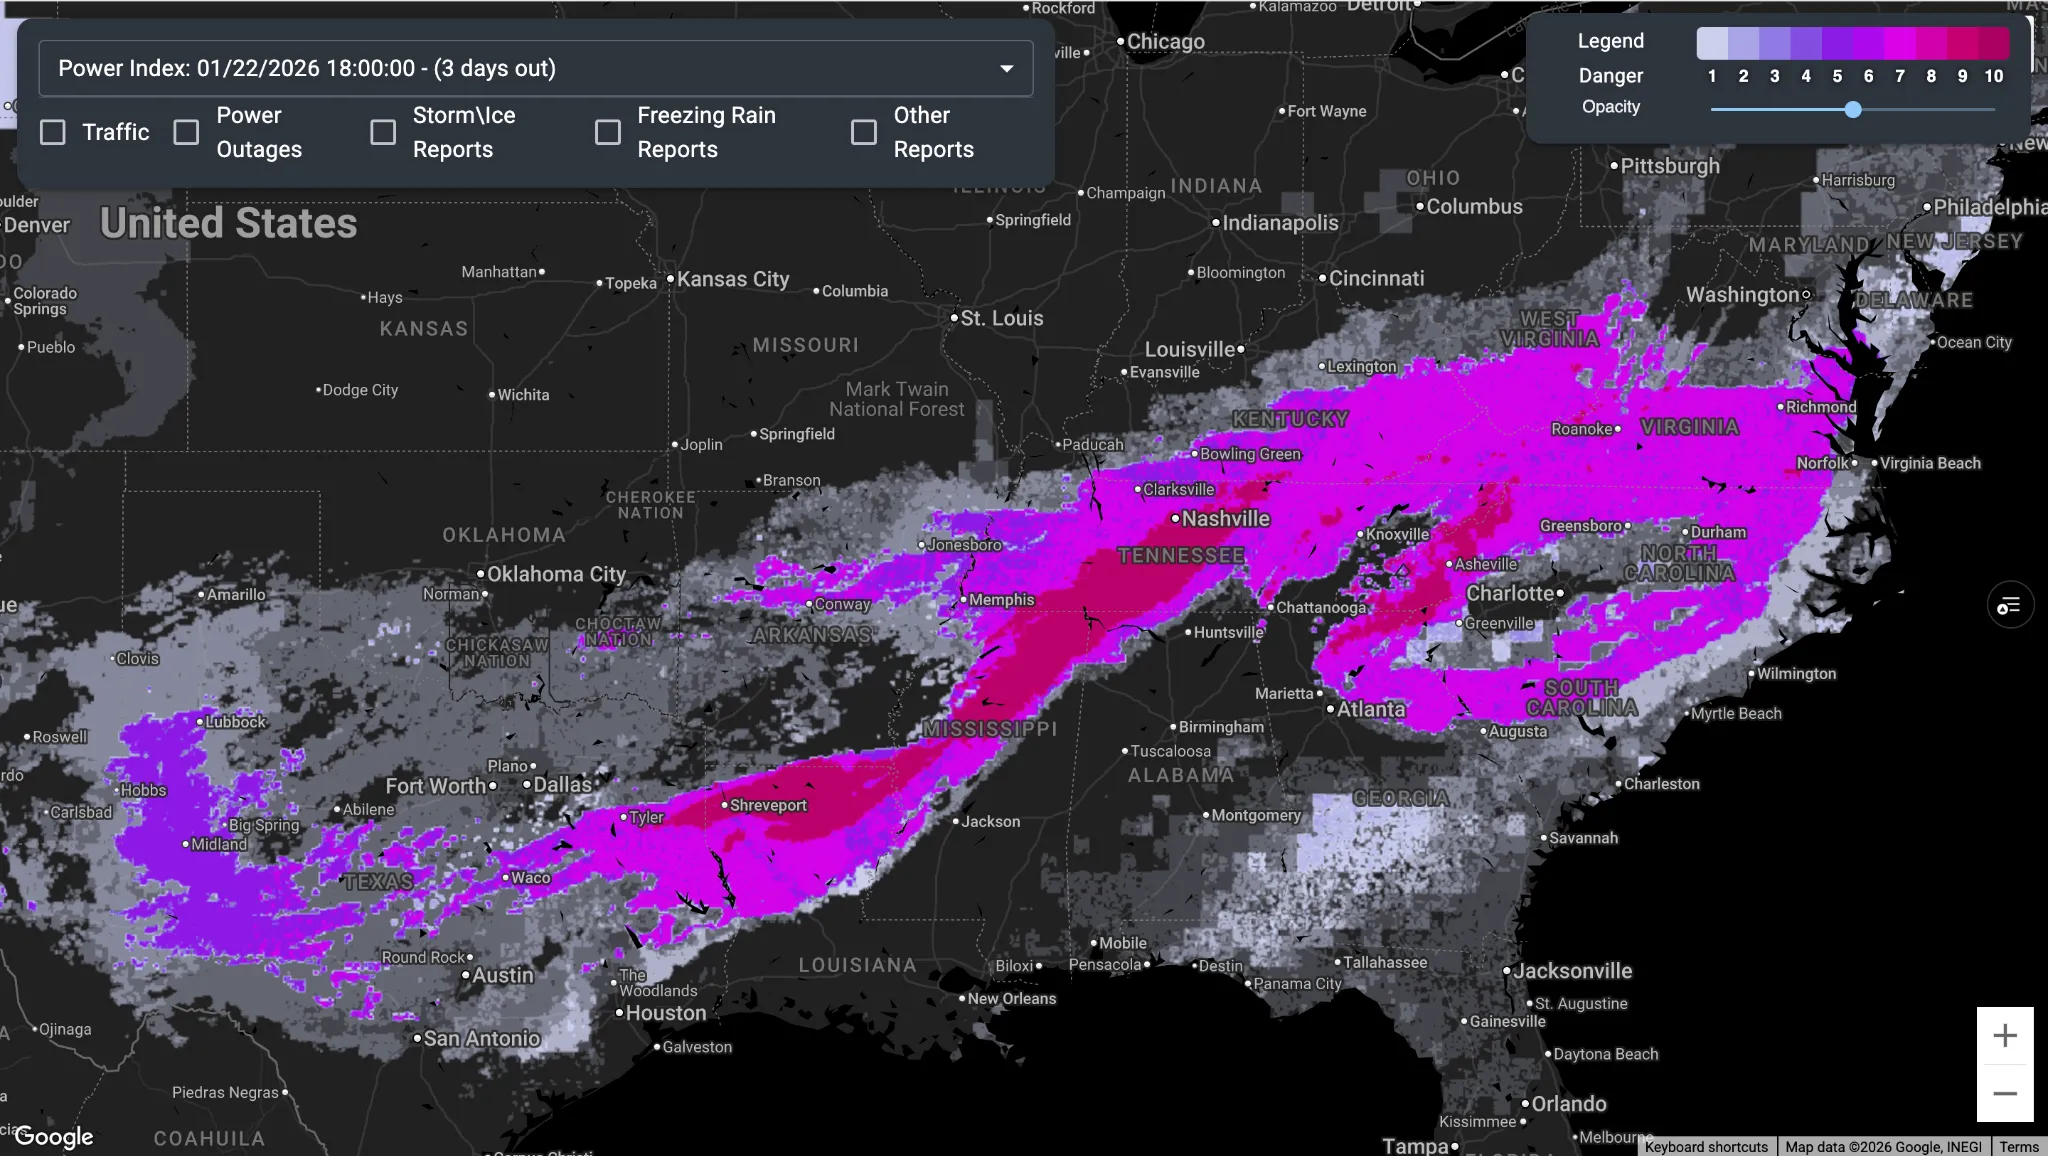
Power: 50 to 80% of customers out along one corridor
Predicted: 50 to 80% of customers losing power across Louisiana, Mississippi and Tennessee, along a corridor running southwest to northeast.
What happened: 60 to 90% of customers lost power, with some Mississippi counties at 100% and outages lasting more than a week.
Scored for your exact location, up to seven days ahead
Our own weather forecast, your operation and 15+ years of what weather has actually done, combined at the resolution your decisions need.
Up to seven days ahead
Every Index looks ahead up to seven days, so your team can plan days out and act hours ahead.
Refreshed every 15 minutes
Built on HYPERR, our own AI weather model, which updates every 15 minutes.
3-km resolution
HYPERR forecasts on a 3-km grid worldwide, so each truck, route and site gets its own score.
Delivered where you already work
In the Impact Intelligence Platform, as text, email or in-cab alerts when your thresholds are crossed, or through the API into your own tools.
See which storms we would have flagged
Send us a handful of past incidents, delayed shipments or storms. We'll show you which ones we would have flagged, how far ahead, and what that was worth.
Become a WeatherOptics insider
Get insights on weather intelligence and operational resilience delivered to your inbox.