
Hyperlocal AI weather forecasts, anywhere on Earth
HYPERR, our own AI weather model, forecasts every weather variable your operation needs on a 3-km grid worldwide, refreshed every 15 minutes, from the next few hours to seven days ahead.
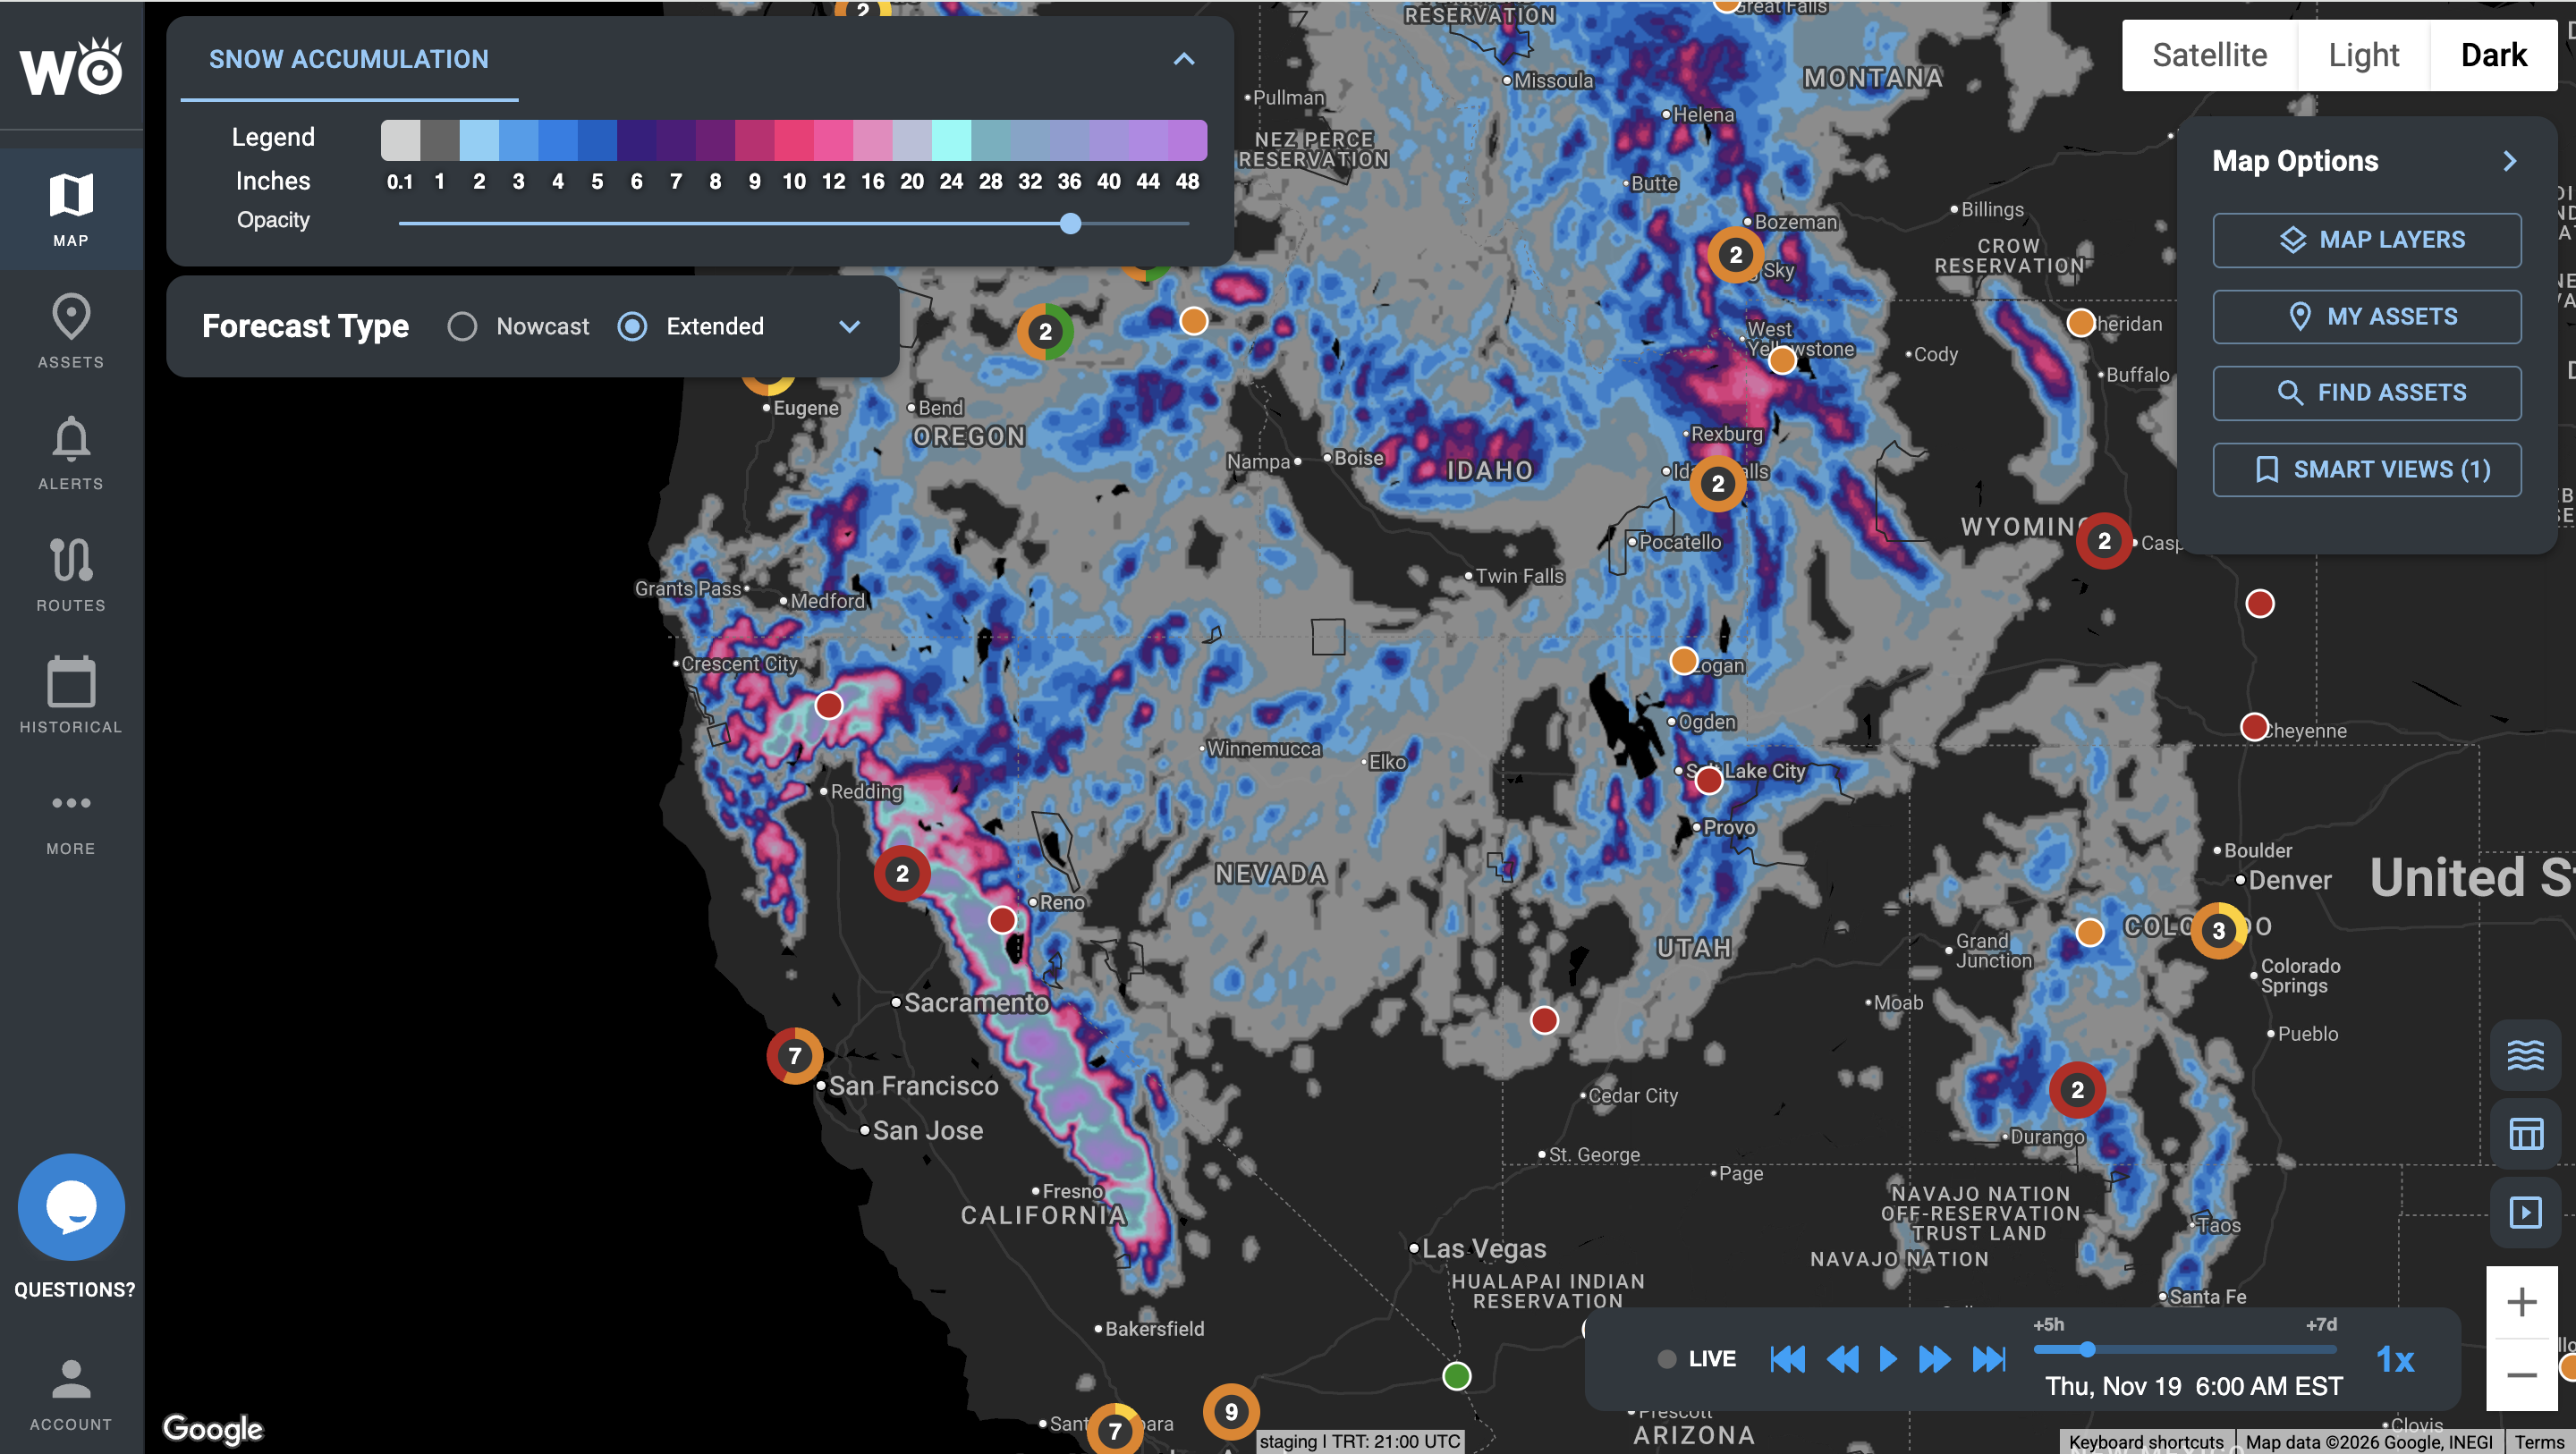
Snow accumulation across the western U.S. from HYPERR, our own AI weather model, in the Impact Intelligence Platform.
Trusted across trucking, logistics and retail








Resolution. A forecast for your exact location, not the nearest city.
Update frequency. Refreshed every 15 minutes with live radar and weather-station data.
Forecast range. The next six hours in 15-minute steps, then out to seven days ahead.
Coverage. Anywhere on Earth, delivered with 99.9% API uptime.
Every kind of weather your operation runs on
These are the core weather variables, for each of your sites, routes and regions: the next six hours in 15-minute steps, then up to seven days ahead. More are available on request.
Precipitation and intensity
Where rain and snow will fall, when, and how hard.
Freezing rain
Where and when rain will freeze on contact with roads and surfaces.
Wind and gusts
Sustained wind and peak gusts at your exact location.
Temperature
Hour-by-hour temperature at each site and along each route.
Visibility
Where fog, heavy rain or snow will cut how far drivers and crews can see.
Lightning
Lightning near your sites, your routes and crews working outdoors.
Radar
Current radar across your region, on the same map as the forecast.
Government alerts
Official watches and warnings, shown against your own sites and routes.
Every variable in the data
In the Impact Intelligence Platform
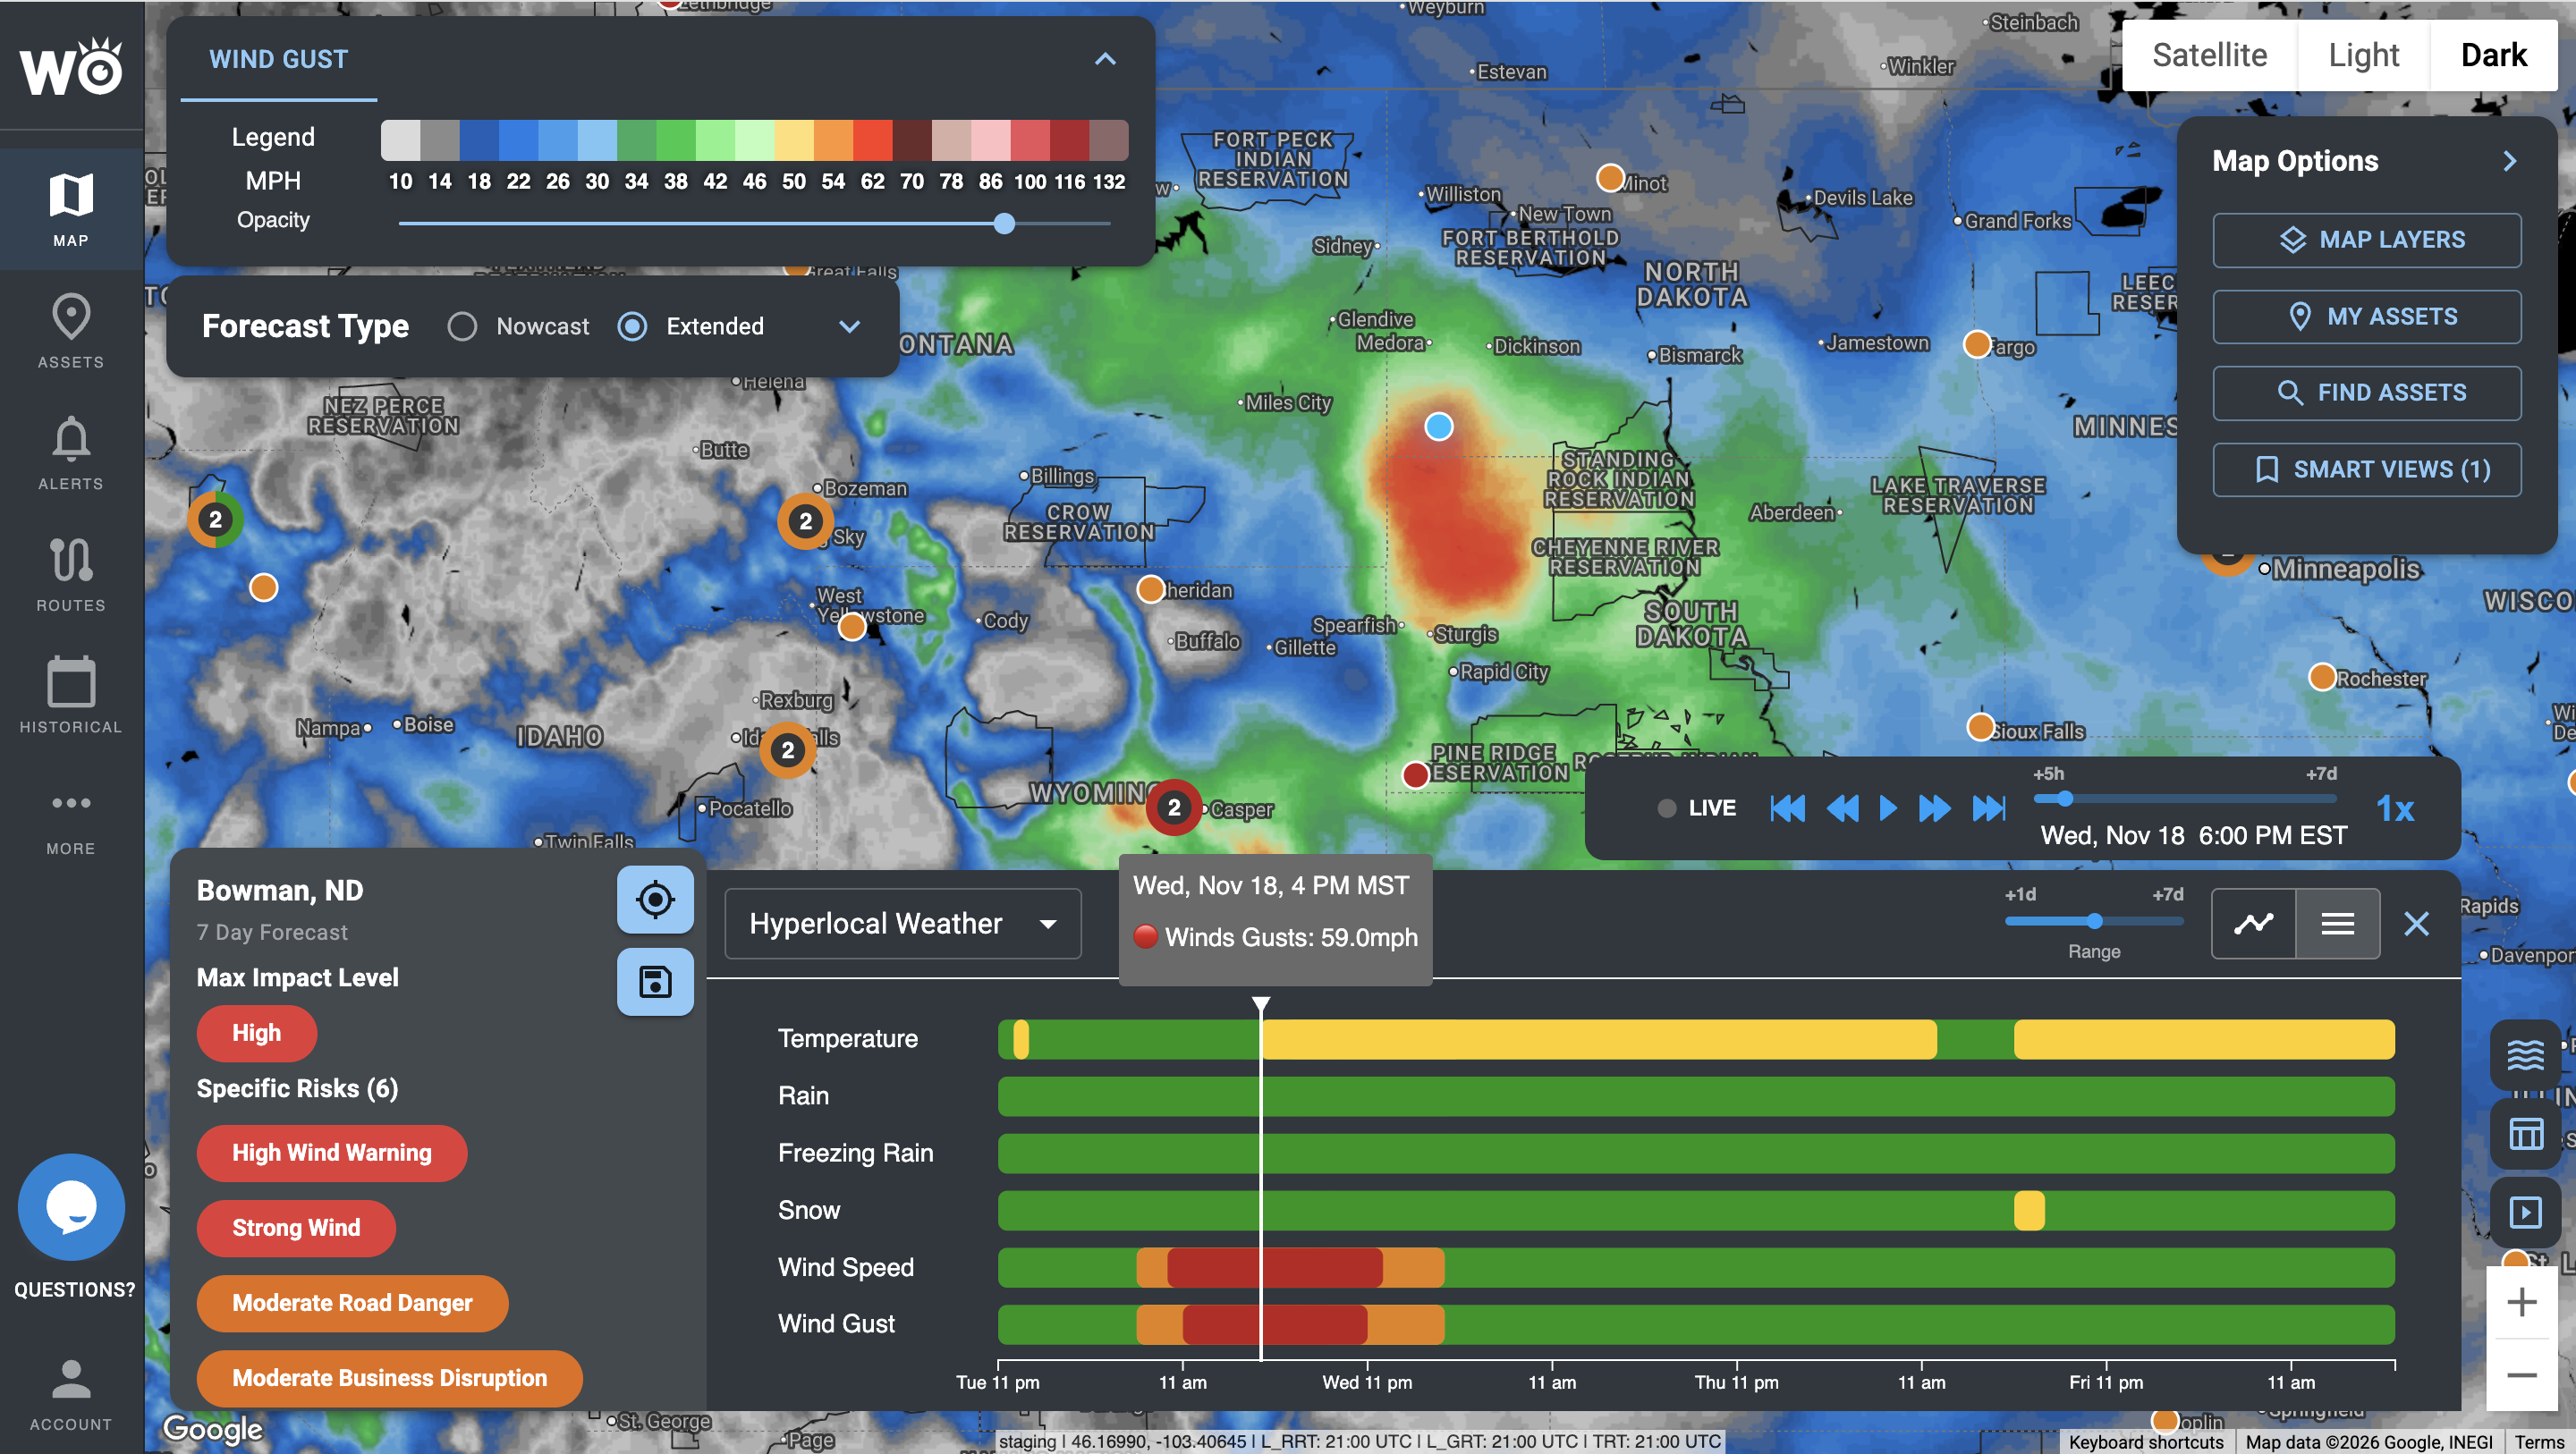
Wind gusts across the northern Plains, with a seven-day, hour-by-hour timeline of every variable for one location.
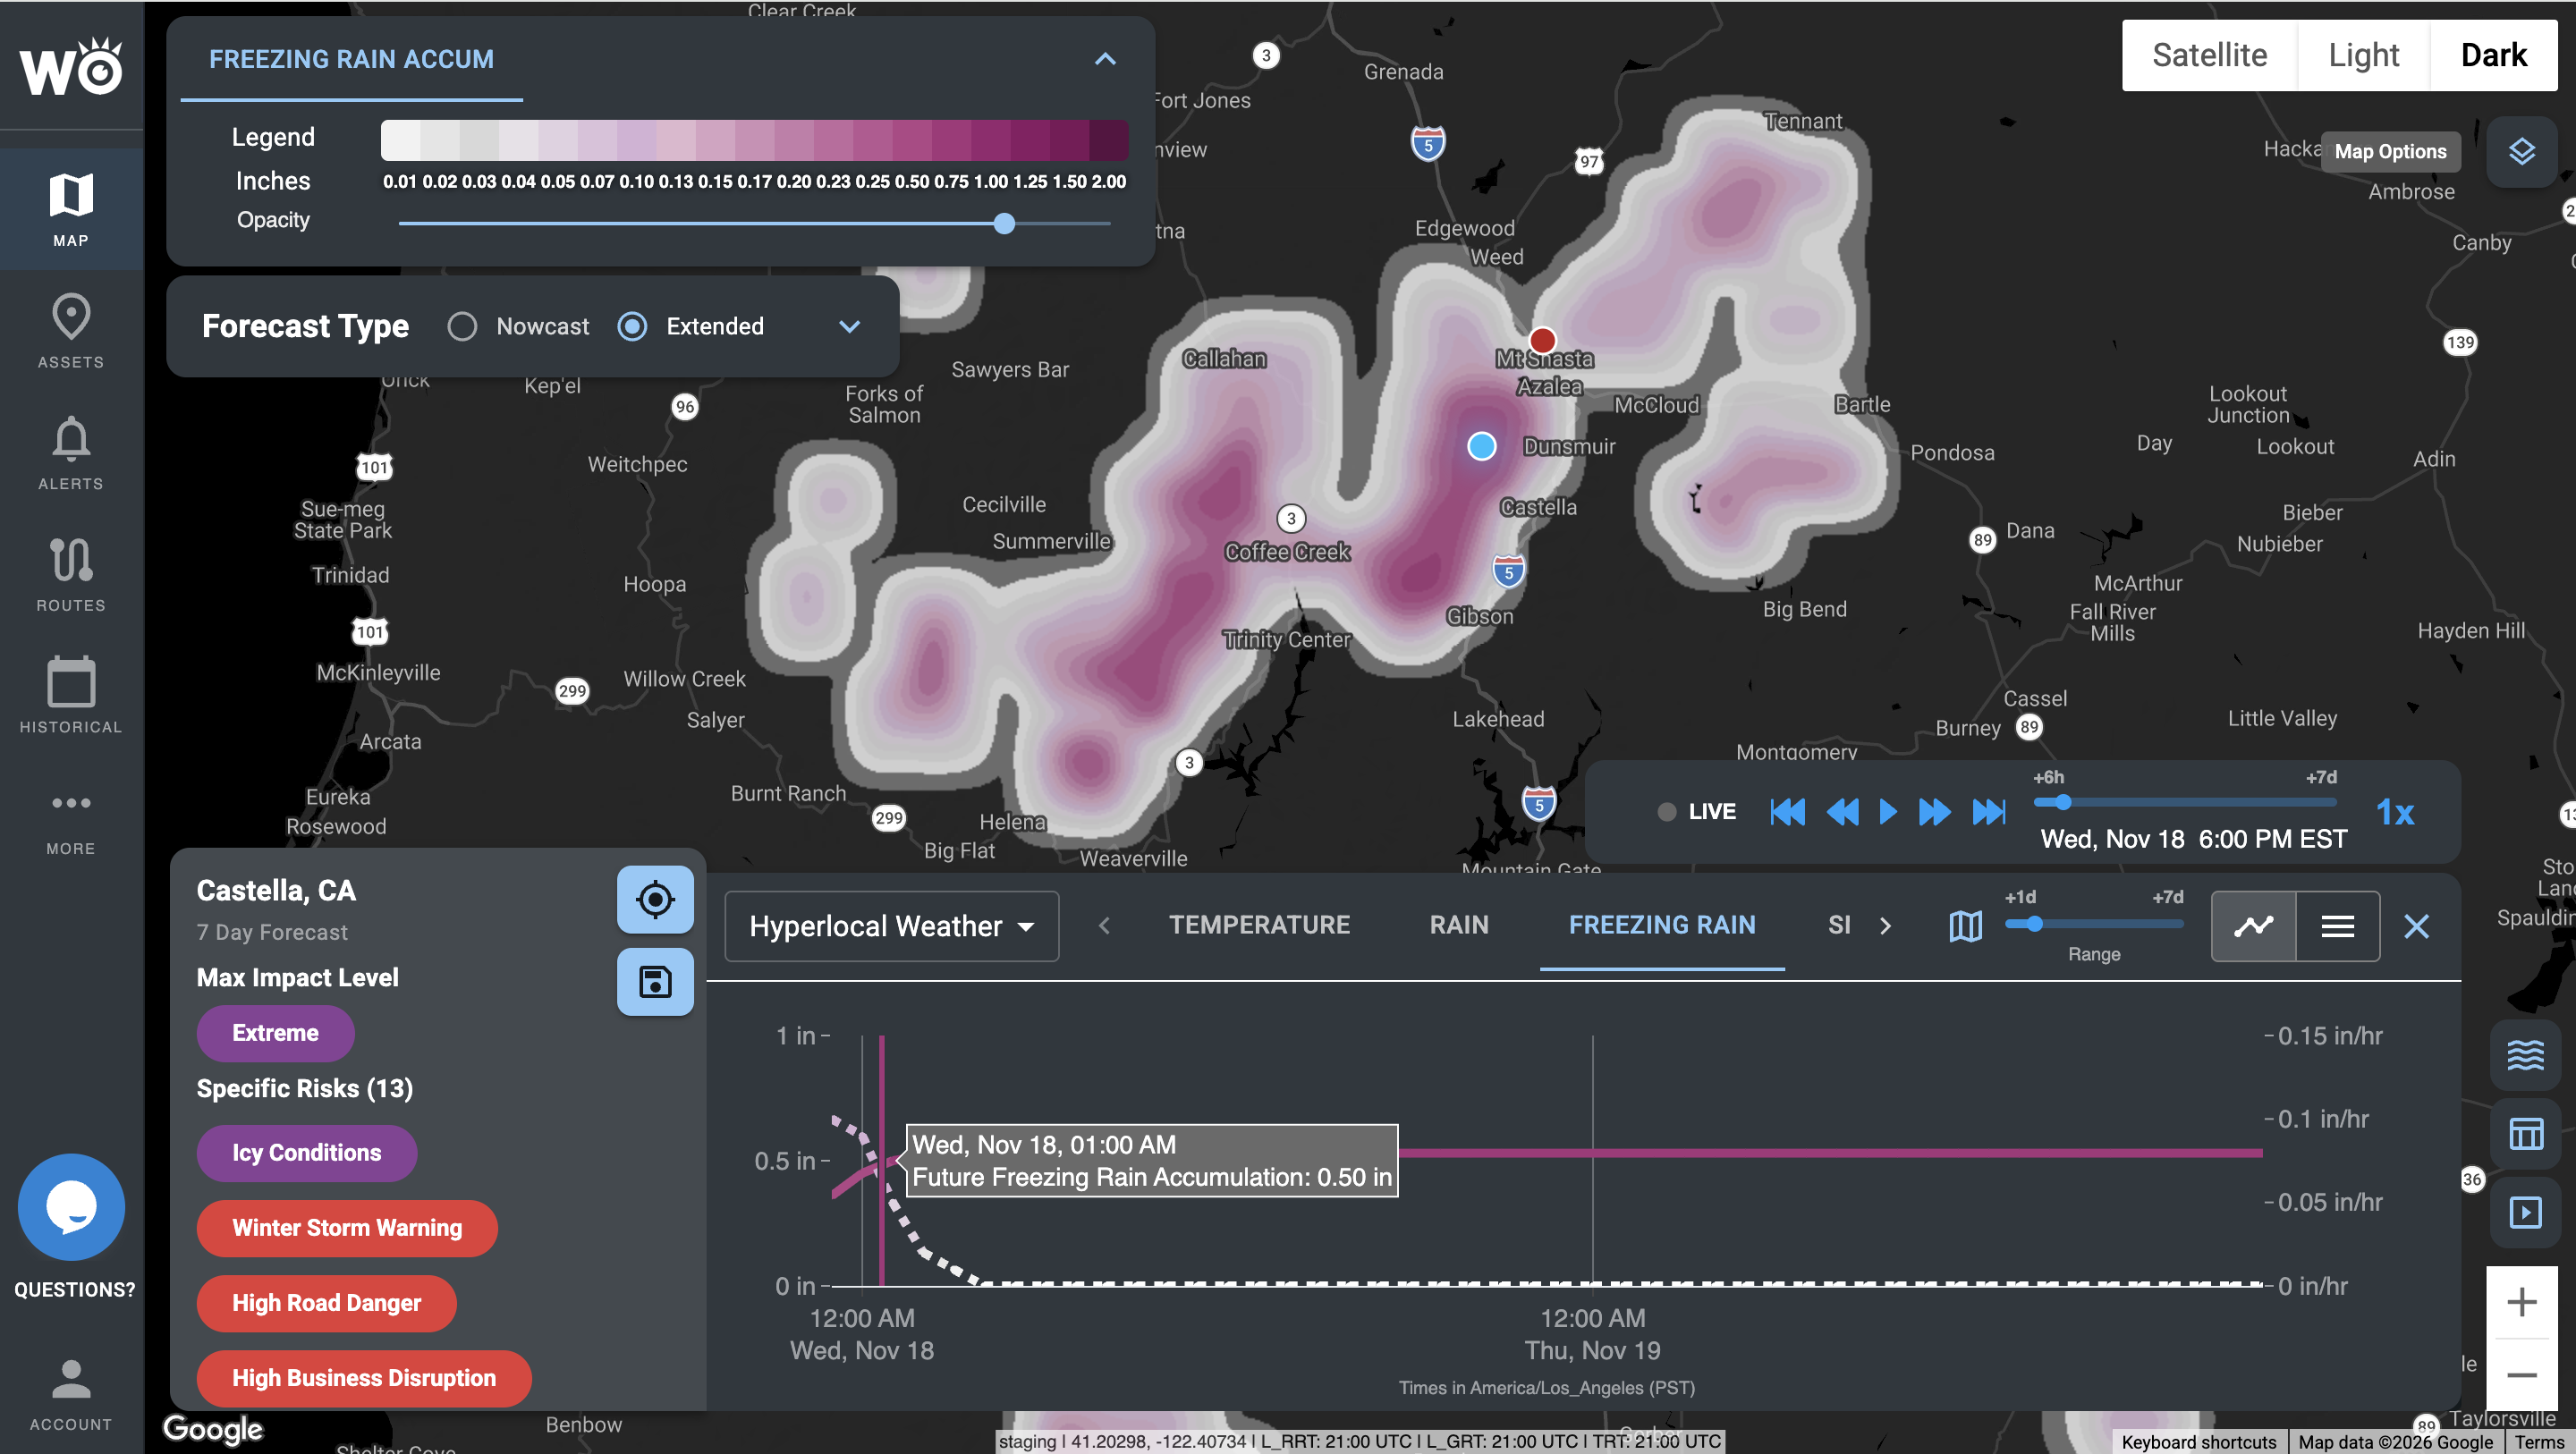
Freezing rain accumulation in northern California, down to the town, with the hourly forecast for a single point.
HYPERR, our AI weather model, beats NOAA's best short-range forecast
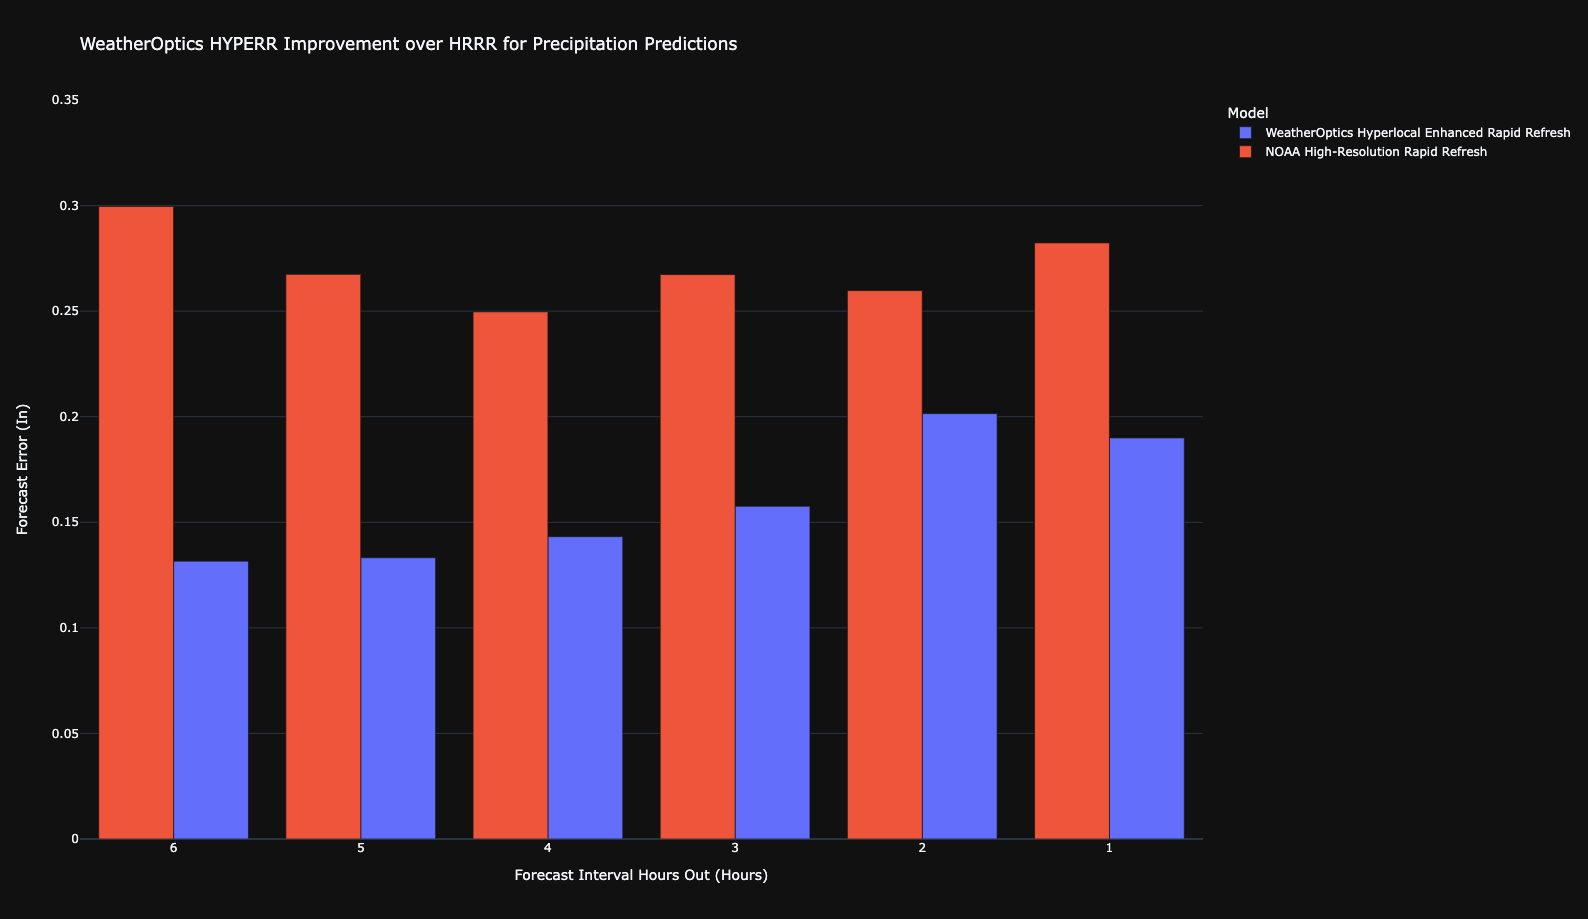
HYPERR blends high-resolution weather models by how well each one is performing, then corrects them in real time with radar, satellite and weather-station observations. Over 12 months across the United States, its forecast error was up to 40% lower than NOAA's.
Precipitation
Forecast error for HYPERR (blue) against NOAA's High-Resolution Rapid Refresh (red), from six hours out to one. Lower is better.
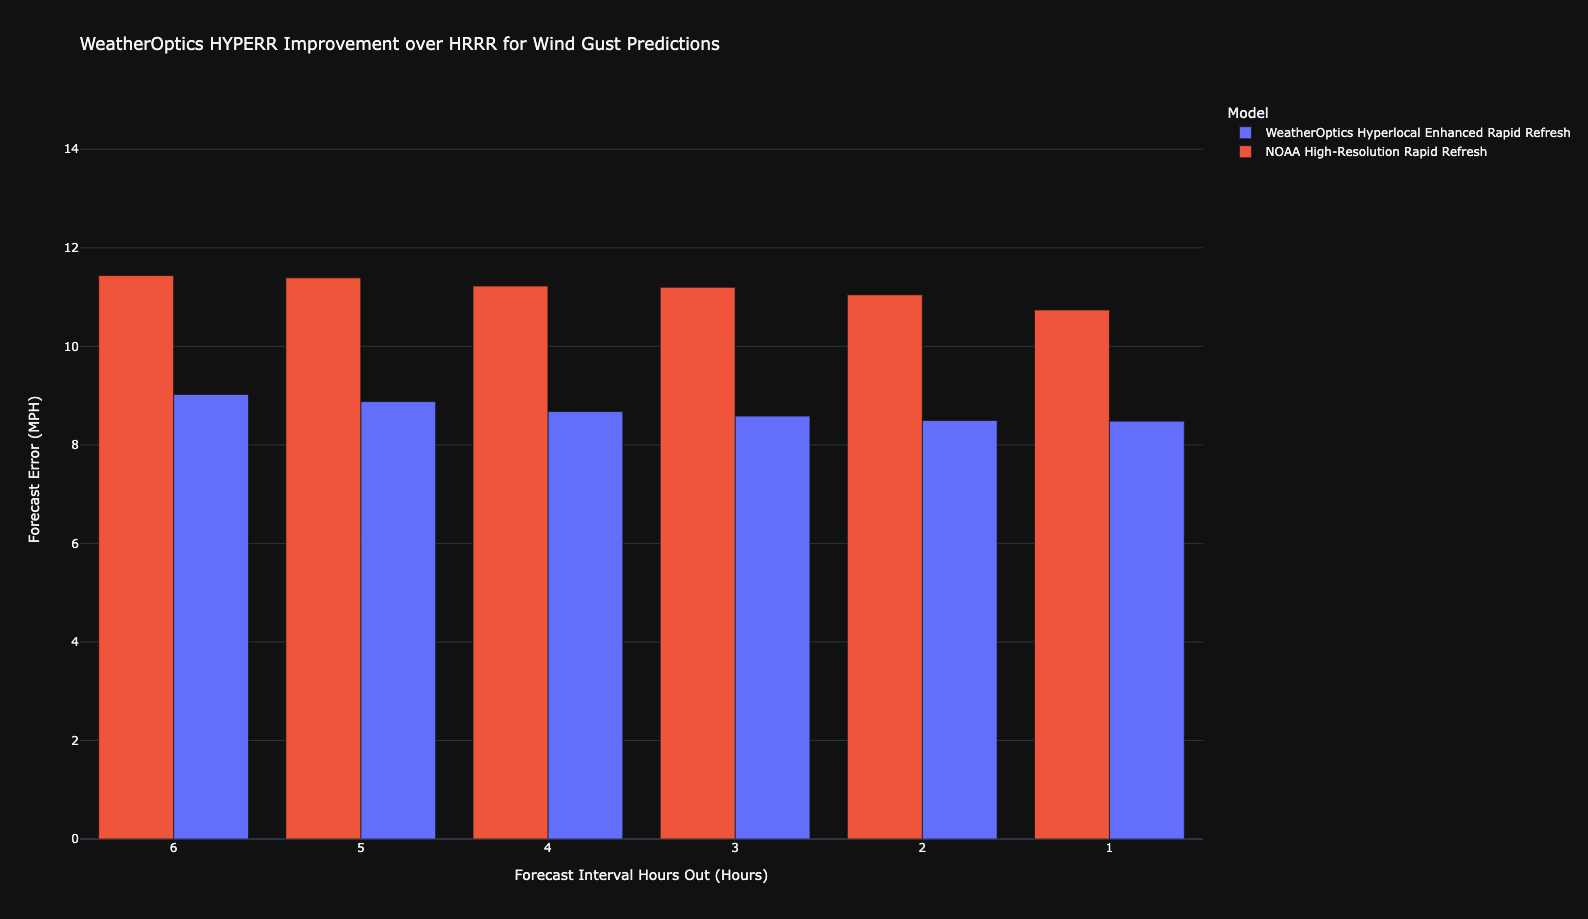
Wind gusts
The same comparison for wind gusts. HYPERR's error is lower at every hour.
Accuracy on wind gusts over 30 mph. Out to 24 hours ahead, with a false alarm rate of about 3% at most.
Accuracy on rainfall rate. Out to 24 hours ahead, with a false alarm rate of about 5% at most.
Accuracy on extreme heat over 95°F. Out to 96 hours ahead, with a false alarm rate of about 2.5% at most.
The model: 3-km resolution worldwide, refreshed every 15 minutes, from now to seven days ahead. Accuracy figures are from 12 months of forecasts across the United States.
Delivered where you already work
Most customers start in the platform; teams that want it automated never have to log in.
Impact Intelligence Platform
Your sites, routes and the forecast on one map, in the browser.
Alerts and briefings
Text, email and in-cab audible alerts, sent only when your thresholds are crossed, plus the morning briefing and event summaries.
API, webhooks and map tiles
Hyperlocal Weather in your own systems, with 99.9% uptime.
Inside your tools
Trimble, Platform Science, Samsara, Juvare WebEOC, Esri ArcGIS, HERE and Google Maps.
The forecast underneath everything WeatherOptics does
Hyperlocal Weather tells you what the weather will be. Every other WeatherOptics product starts from that same forecast and tells you what it will do to you.
Impact Models
0 to 10 risk scores for roads, power, flooding and more, built on the HYPERR forecast. Explore Impact Models
Critical Events
Hurricanes, ice storms and severe weather outbreaks, tracked against your assets days ahead. Explore Critical Events
Shipment Intelligence
The forecast simulated along every planned route, for weather-adjusted ETAs and safer options. Explore Shipment Intelligence
Fleet Intelligence
The forecast on the road ahead of every vehicle, with alerts to dispatch and the driver. Explore Fleet Intelligence
Wildfire Intelligence
Wind, humidity and soil moisture feeding where new fire is likely and where active fire will spread. Explore Wildfire Intelligence
Alerts and briefings
Every threshold alert and morning briefing we send starts from the same forecast.
See which storms we would have flagged
Send us a handful of past incidents, delayed shipments or storms. We'll show you which ones we would have flagged, how far ahead, and what that was worth.
Become a WeatherOptics insider
Get insights on weather intelligence and operational resilience delivered to your inbox.