
Predict the impact, then watch it unfold in real time
Impact Models tell you what is coming. Impact Reports show what is happening as it happens: where power is out, where the damage is and which roads have closed, mapped against your sites so you can act while there is still time.
Impact Reports in the Impact Intelligence Platform: storm reports, power outages and road closures across South Florida.
Trusted across emergency management, trucking, logistics and retail







Every report of what the weather actually did
Seven kinds of reports, shown against your sites, routes and regions.
Live Road Status
Closures, truck restrictions, accidents, construction and live road cameras. Also available on its own.
Power outages
Where the power actually went out, against your stores and sites.
Damage reports
Where storms caused damage, for response, recovery and claims.
Satellite fire detections
Fires detected by satellite, mapped against your sites, regions and routes.
Lightning strikes
Where lightning actually struck, near your sites and crews.
Earthquakes
Where the ground shook, and which of your sites are nearby.
Airport closures
Which airports have closed, for the shipments and travel that depend on them.
Predicted four days out. Confirmed on the ground.
Four days before Hurricane Helene hit, the Power Outage Index showed where the grid would fail. Impact Reports then showed where it did, so response starts in the right place and recovery has a record.
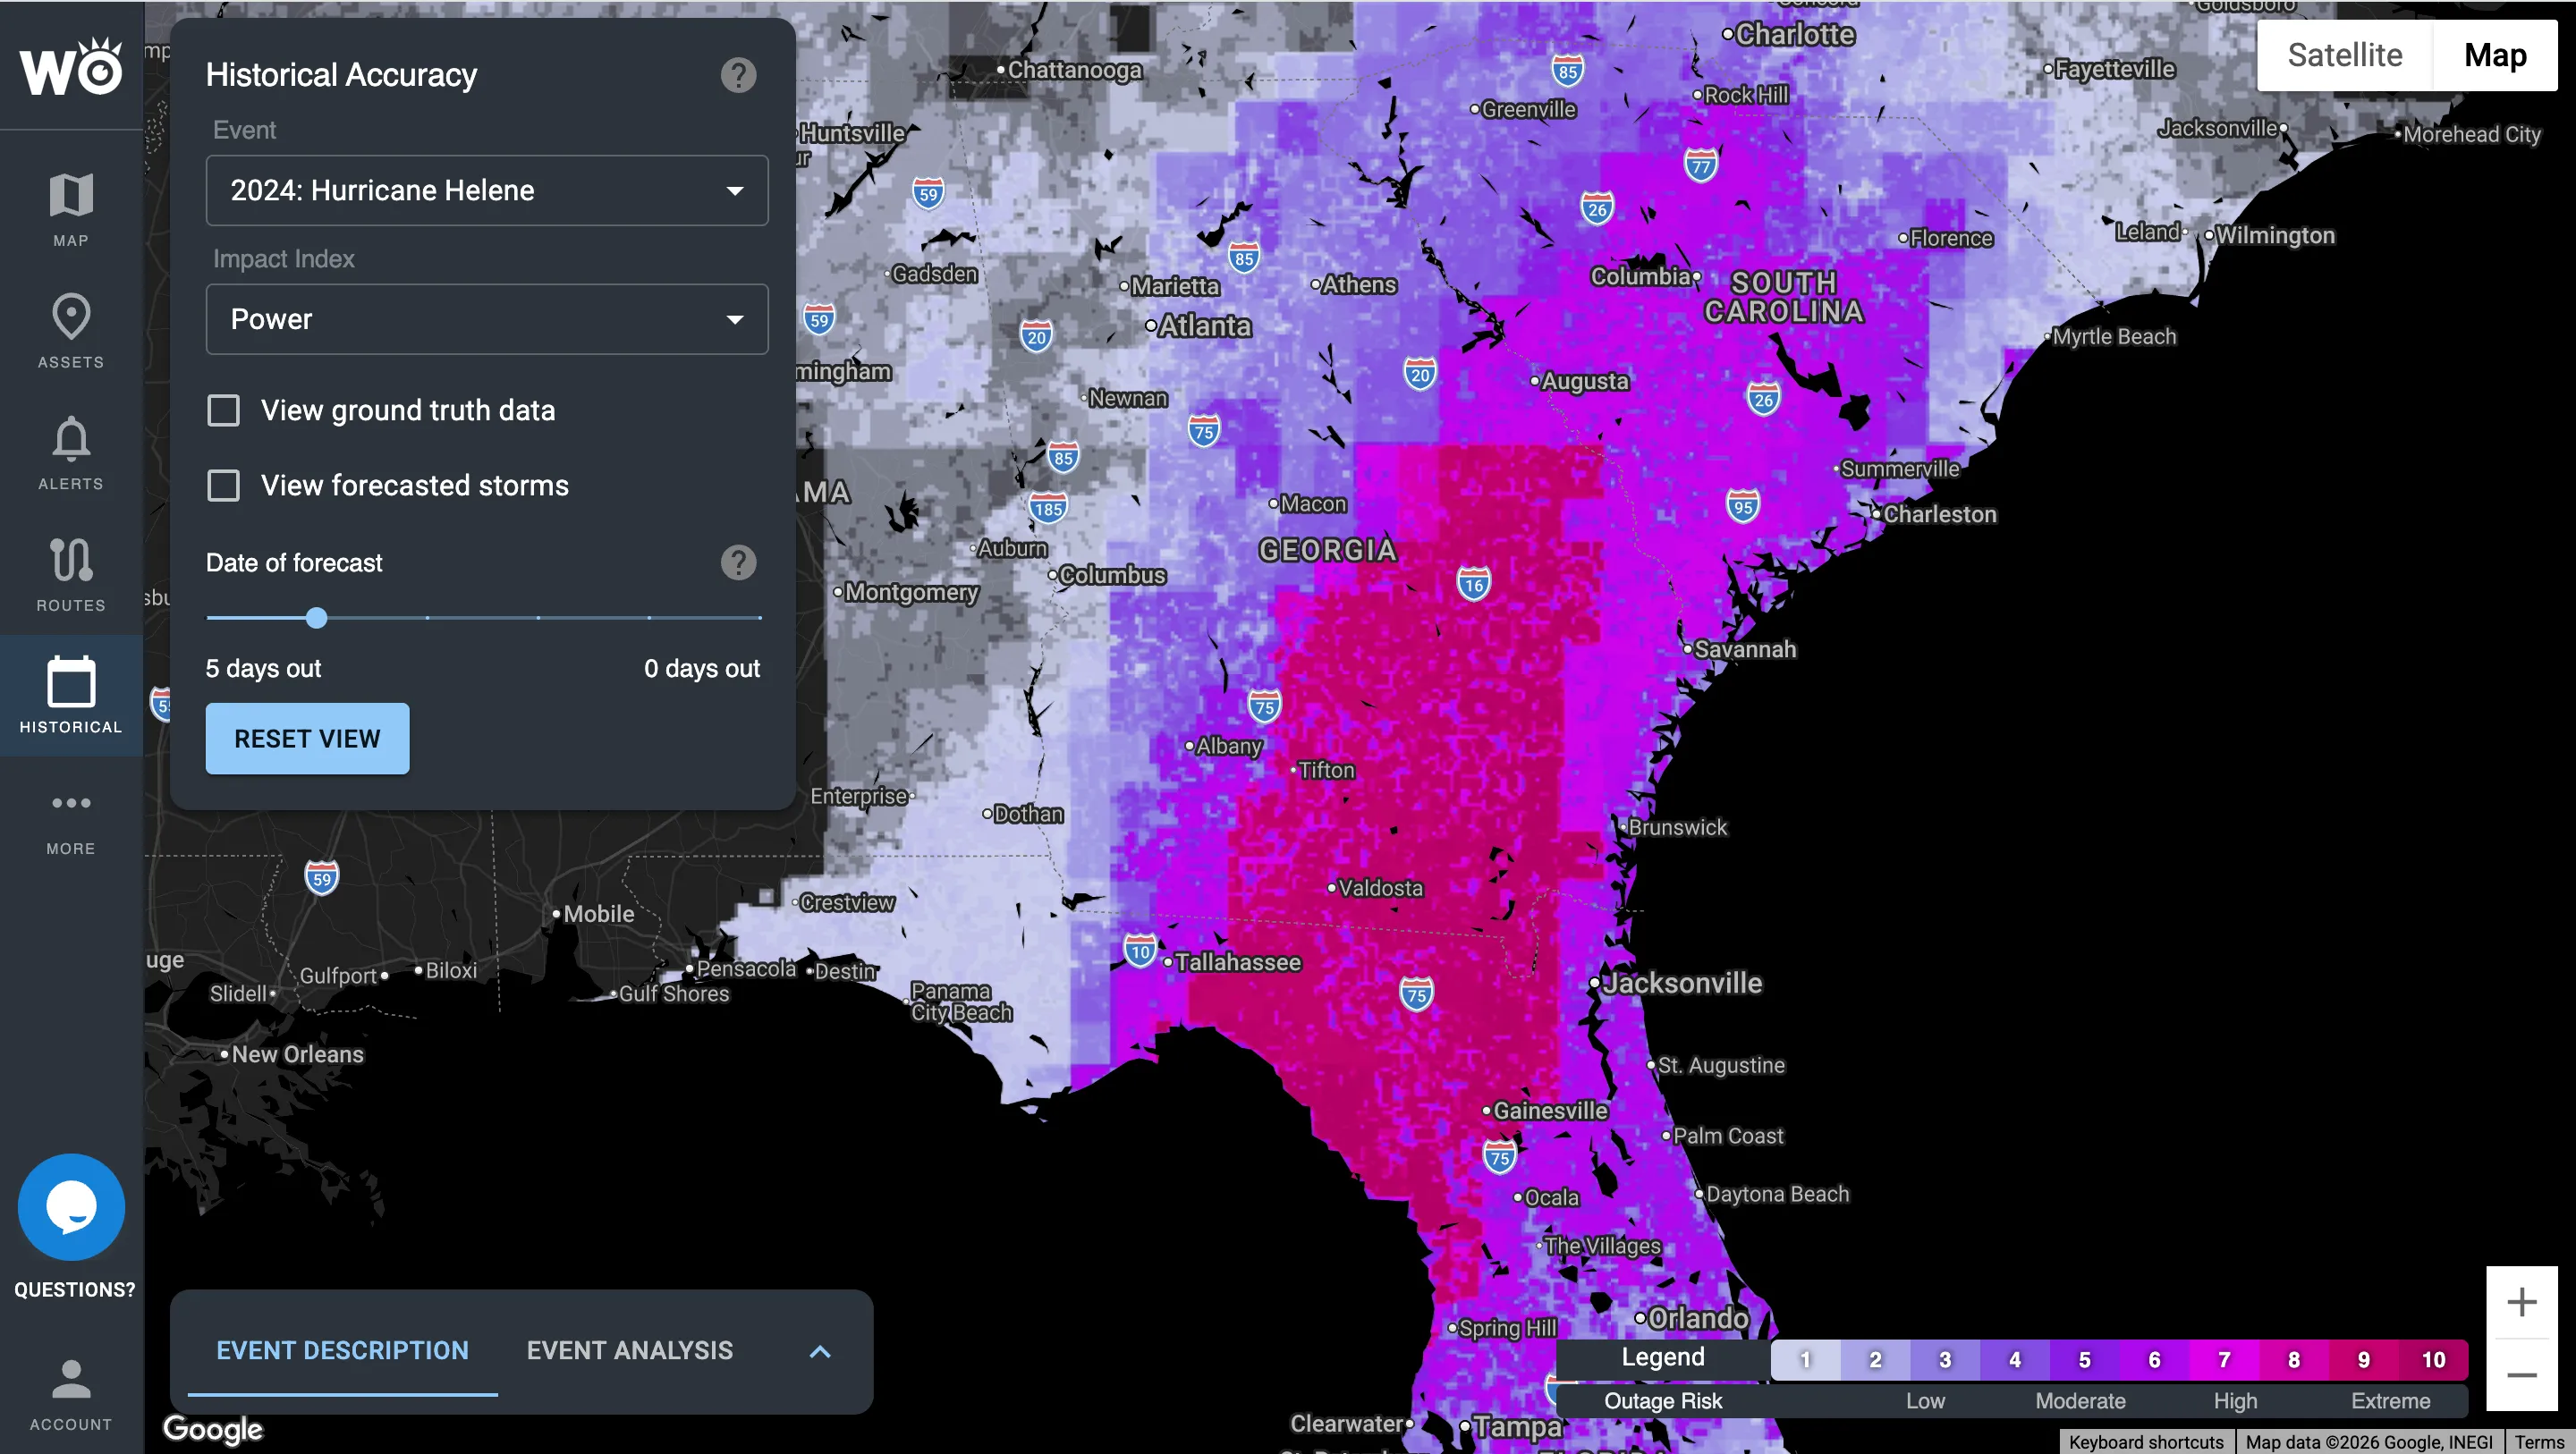
The forecast, four days out
The Power Outage Index flagged extreme outage risk from Florida's Big Bend through Georgia and into the Carolinas.
Explore Impact Models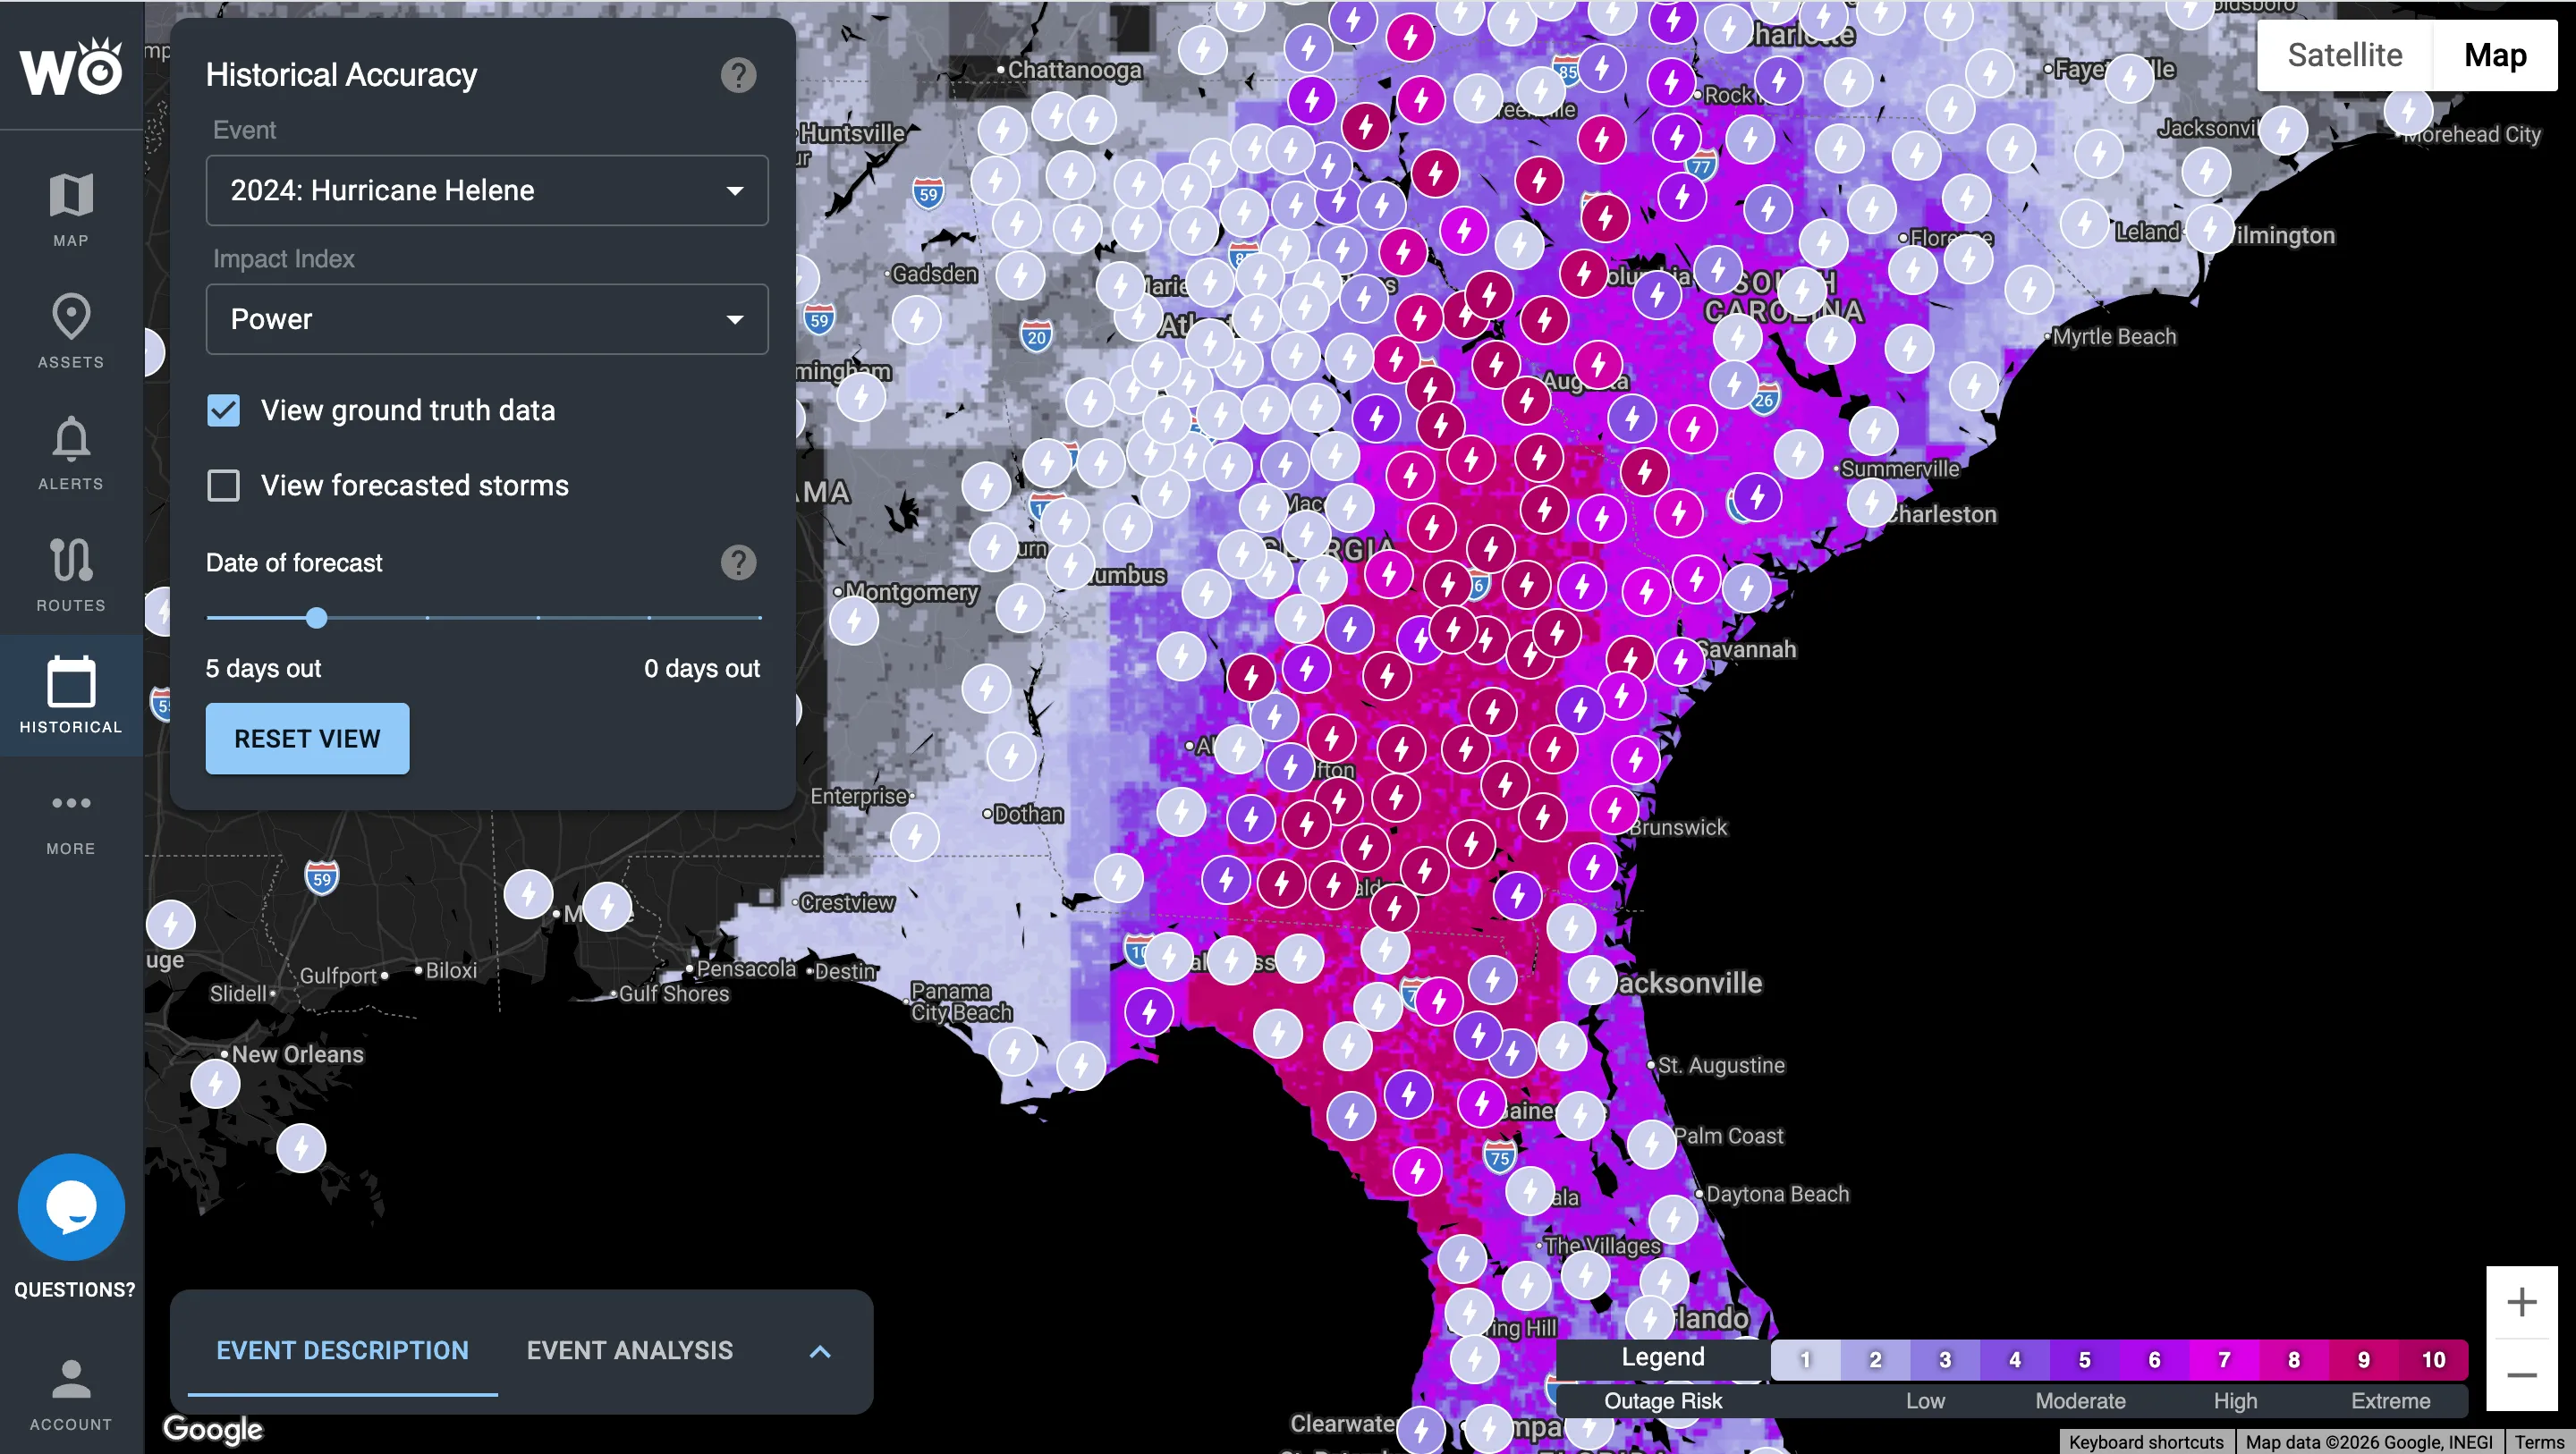
What actually happened
Each marker is a reported outage, and the worst of them fell along the same corridor. Use the record for claims, reviews and disaster declarations.
Every closure, accident and truck warning in one view, not state by state
Today most teams check road conditions one state at a time, with a different website for every state a truck crosses. Live Road Status brings closures, accidents and truck warnings from across the U.S. and Canada into a single view, so you find the problem in seconds and act sooner.
Today: state by state
With Live Road Status
One map for every state and province
Closures, accidents, construction and truck restrictions, plus 40,000+ live road cameras, on the same map as your trucks, routes and sites.
Explore Live Road StatusDelivered where you already work
Most customers start in the platform; teams that want it automated never have to log in.
Impact Intelligence Platform
Your sites, routes and what actually happened, on one map in the browser.
Alerts and briefings
Text, email and in-cab audible alerts, sent only when your thresholds are crossed, plus event summaries after the storm.
API, webhooks and map tiles
Impact Reports in your own systems, with 99.9% uptime.
Inside your tools
Trimble, Platform Science, Samsara, Juvare WebEOC, Esri ArcGIS, HERE and Google Maps.
See which storms we would have flagged
Send us a handful of past incidents, delayed shipments or storms. We'll show you which ones we would have flagged, how far ahead, and what that was worth.
Become a WeatherOptics insider
Get insights on weather intelligence and operational resilience delivered to your inbox.